Vortex Shedding Past Square Cylinder
Sample Data Plots
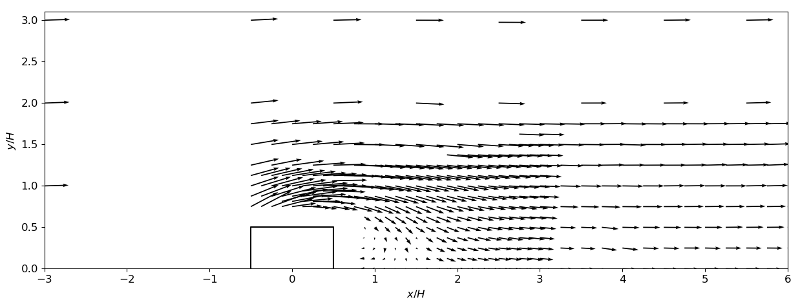
The plot below shows mean velocity vectors of the flow around the cylinder.
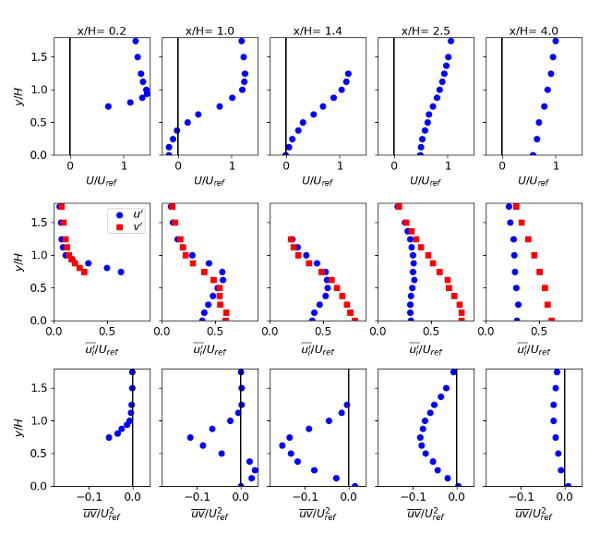
The plots below show profiles of the time-averaged mean \(U\) velocity and Reynolds stress components at selected streamwise locations.
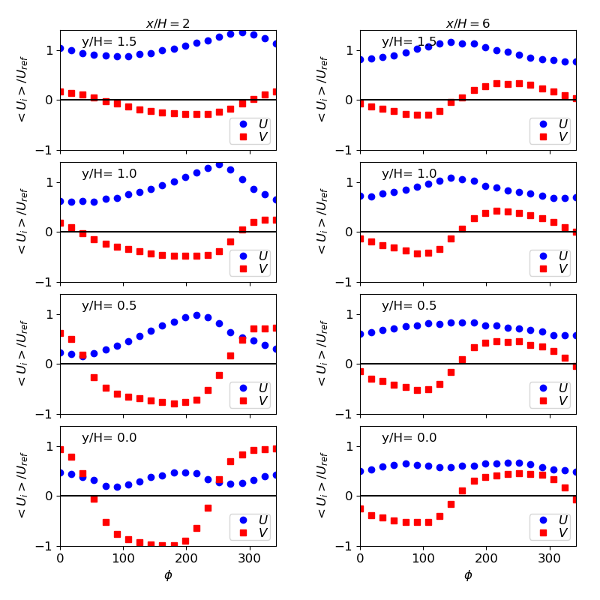
The plots below show the phase variation of the mean \(U\) and \(V\) velocities at selected \(y\) locations for two downstream positions.


