Three-Dimensional Boundary Layer and Flow Field Data on an Inclined Prolate Spheroid
Sample Data Plots
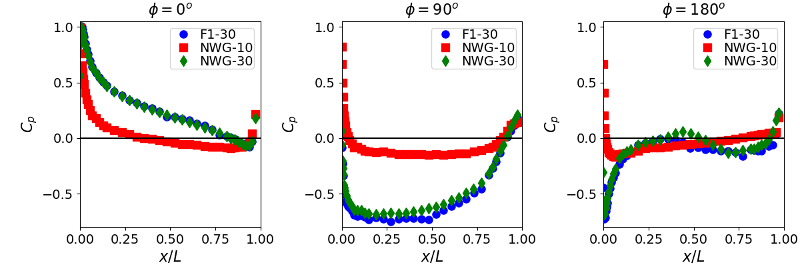
The plots below show the variation of surface pressure coefficient along the spheroid at selected angles around the body for the three cases (\(\phi=0^o\) corresponds to vertically downwards).
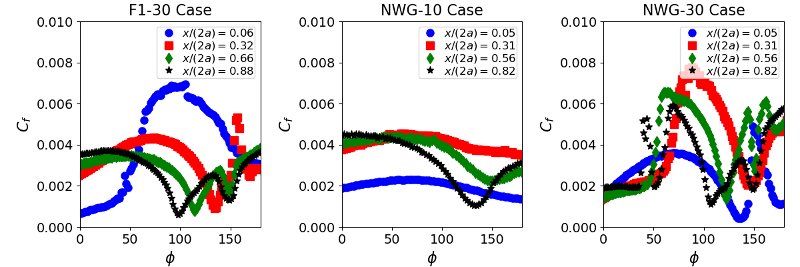
The plots below show the variation of skin friction coefficient around the spheroid at a selection of axial locations along it for the three cases.
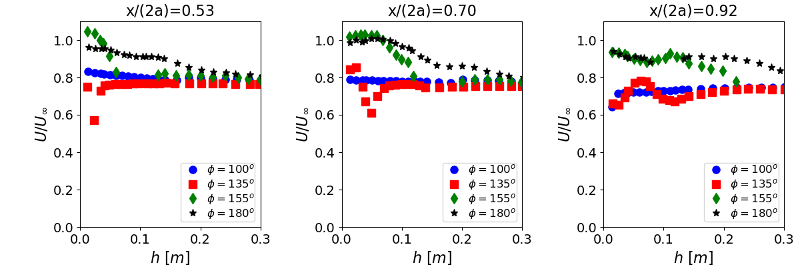
The plots below show profiles of the mean \(U\) velocity along lines normal to the spheroid surface at a selection of axial locations and angles around the body for the F1-30 case.
The plots below show profiles of the mean \(U\) velocity in the boundary layer along lines normal to the spheroid surface at a selection of axial locations and angles around the body for the NWG-10 case.
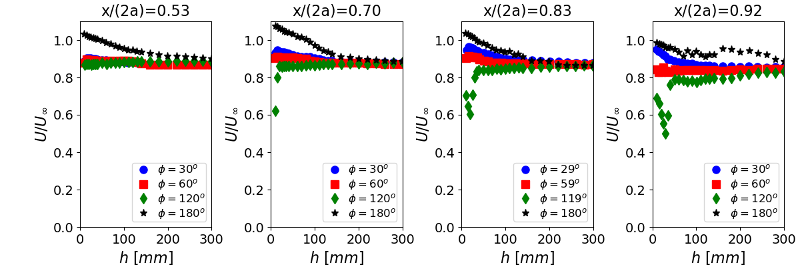
The plots below show profiles of the mean \(U\) velocity along lines normal to the spheroid surface at a selection of axial locations and angles around the body for the NWG-30 case.


