Flow through Staggered Tube Bundle
Sample Data Plots
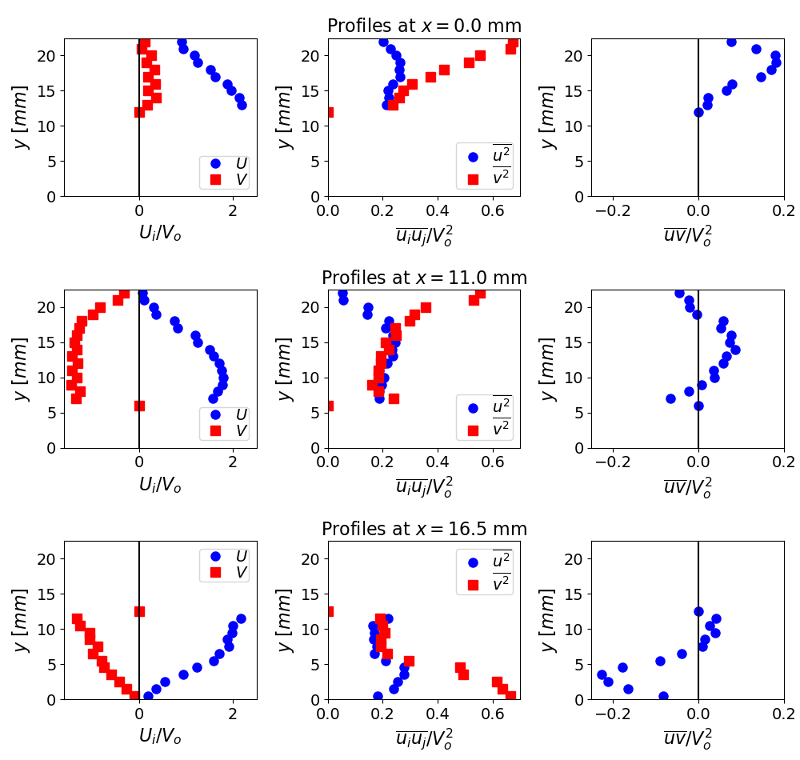
The plots below show profiles of the mean velocities and Reynolds stresses across the gaps between tubes at the three \(x\) locations, \(x=0\), \(11\) and \(16.5\) mm.
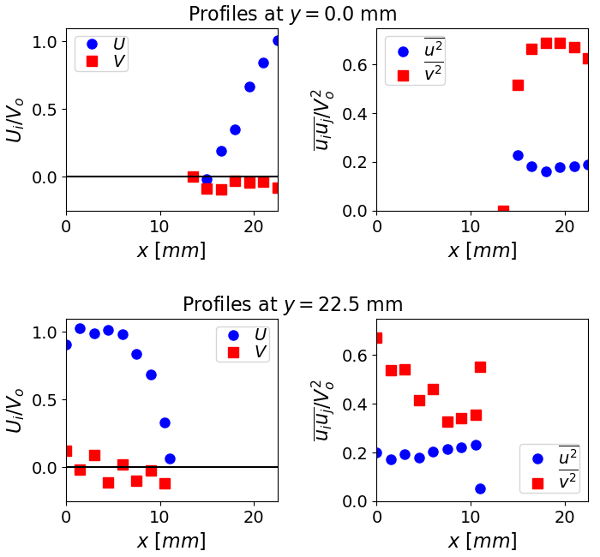
The plots below show profiles of the mean velocities and Reynolds normal stresses across the gaps between tubes at the two \(y\) locations, \(y=0\) and \(22.5\) mm.

