Wall-Mounted 2-D Hump with Oscillatory Zero-Mass-Flux Jet or Suction through a Slot
Sample Data Plots
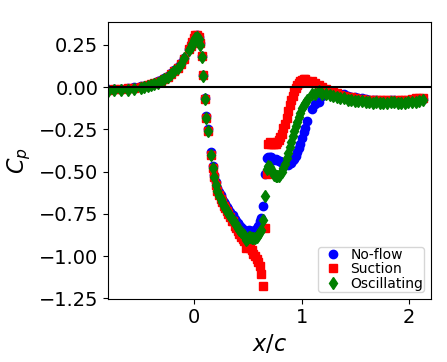
The plot below shows mean wall \(C_p\) profiles for the no-flow-control case, the suction control case, and time-averaged wall \(C_p\) for the oscillatory control case.
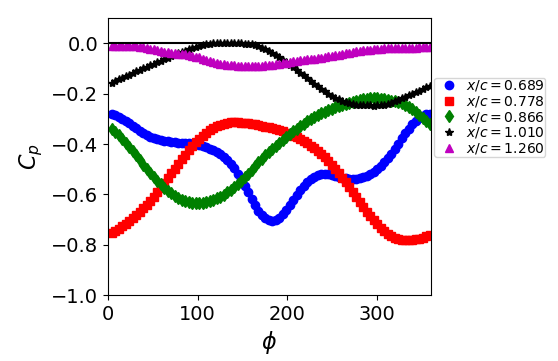
The plot below shows phase-averaged wall \(C_p\) at a selection of streamwise locations for the oscillatory control case.
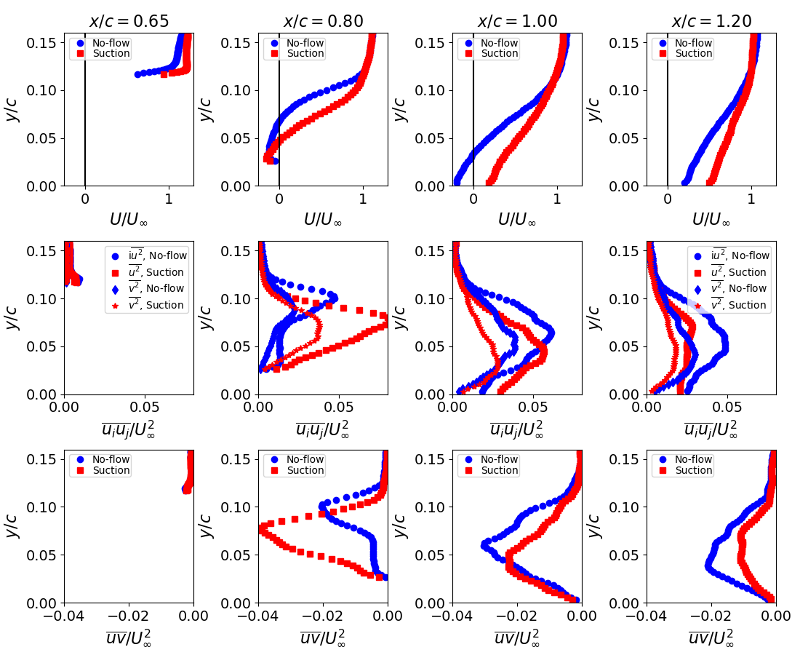
The plots below show profiles of the mean \(U\) velocity, and \(\overline{u^2}\), \(\overline{v^2}\) and \(\overline{uv}\) Reynolds stresses at a selection of streamwise locations for the no-flow-control and suction control cases.
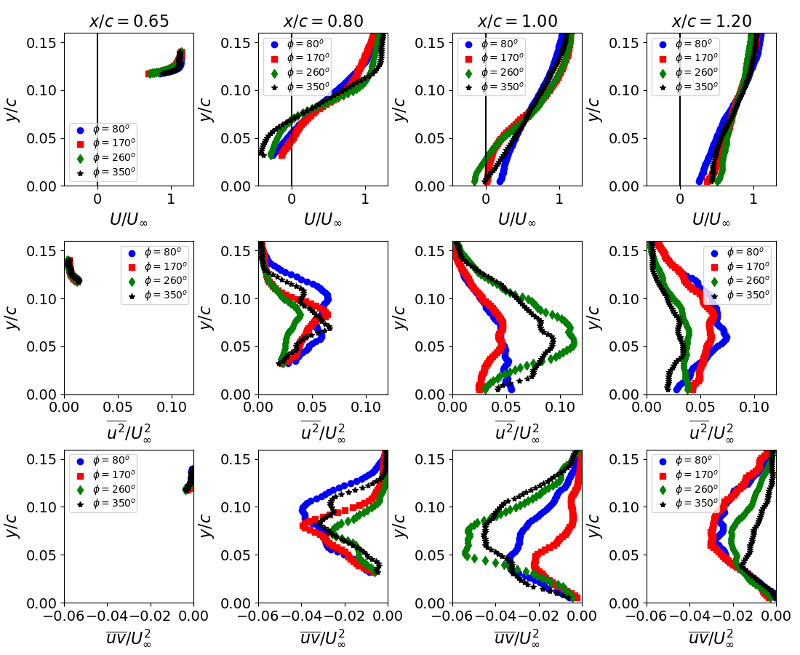
The plots below show phase-averaged profiles of the mean \(U\) velocity, and \(\overline{u^2}\) and \(\overline{uv}\) Reynolds stresses at a selection of streamwise locations and phase angles for the oscillatory control case.
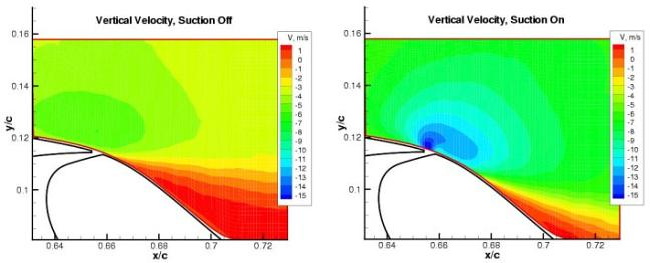
The plots below show contours of the mean vertical velocity in the no-flow-control case (left) and the suction control case (right).
