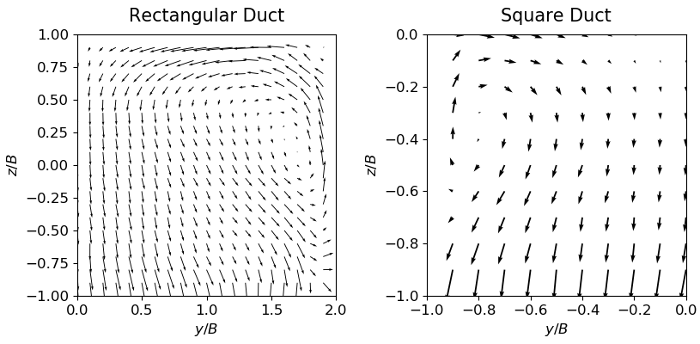
The plots below show secondary flow vectors across the two ducts. (Making use of symmetries, a
quarter of the square duct is shown, and half of the rectangular one).

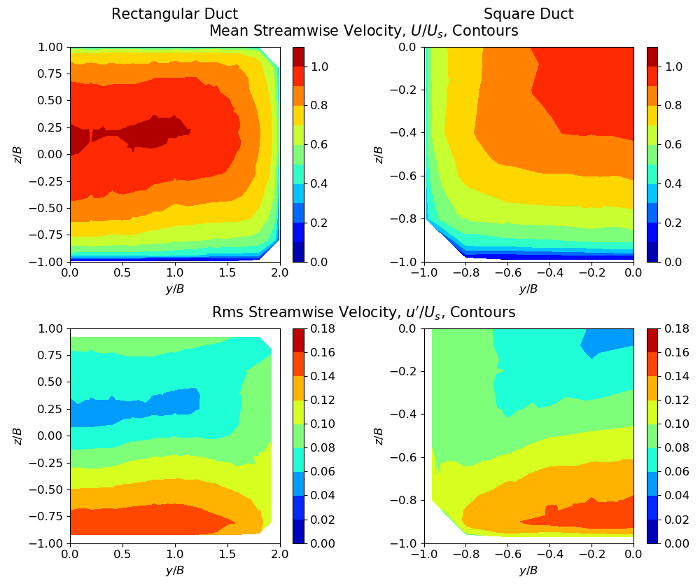
The plots below show contours of mean streamwise velocity and rms streamwise velocity
fluctuations in the two ducts.
