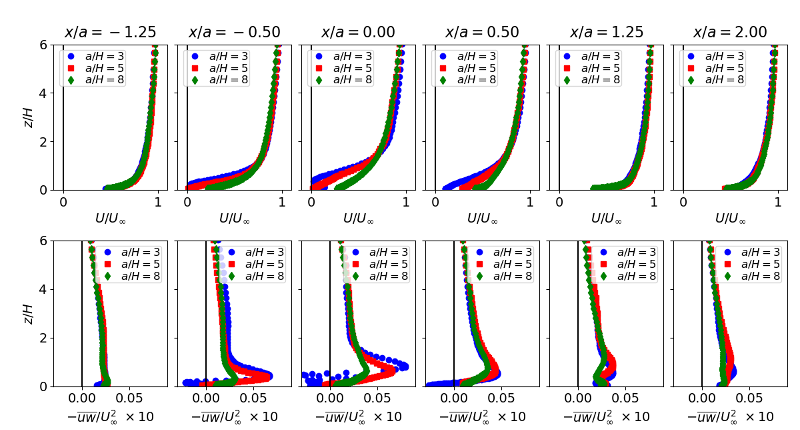
The plots below show profiles of the mean \(U\) velocity and Reynolds shear stress
at selected streamwise locations for the three valley geometries.

The plots below show profiles of the rms fluctuating velocities \(u'\) and \(w'\)
for the \(a/H=3\) valley case.
