Laterally Strained Boundary Layers
Sample Data Plots
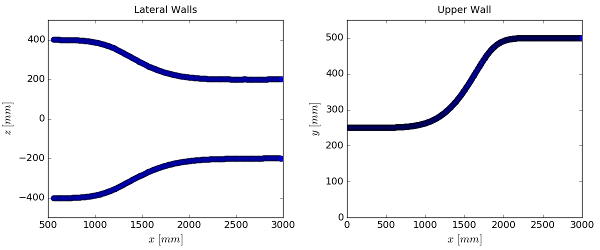
The graphs below show the profiles of the side and top wall along the duct for the laterally converging wall case. The diverging case is the same duct, but reversed.
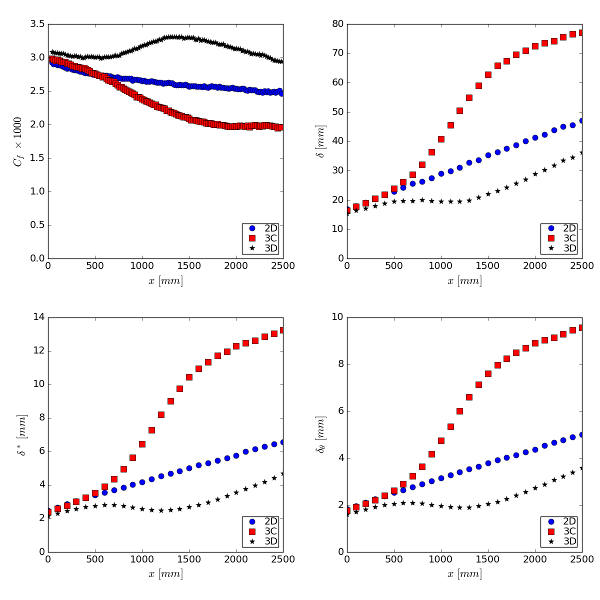
The graphs below show the development of the wall friction coefficient, and boundary layer thickness parameters along the duct centreline for the three cases (2D = flat plate boundary layer, 3C = converging case, 3D = diverging case).
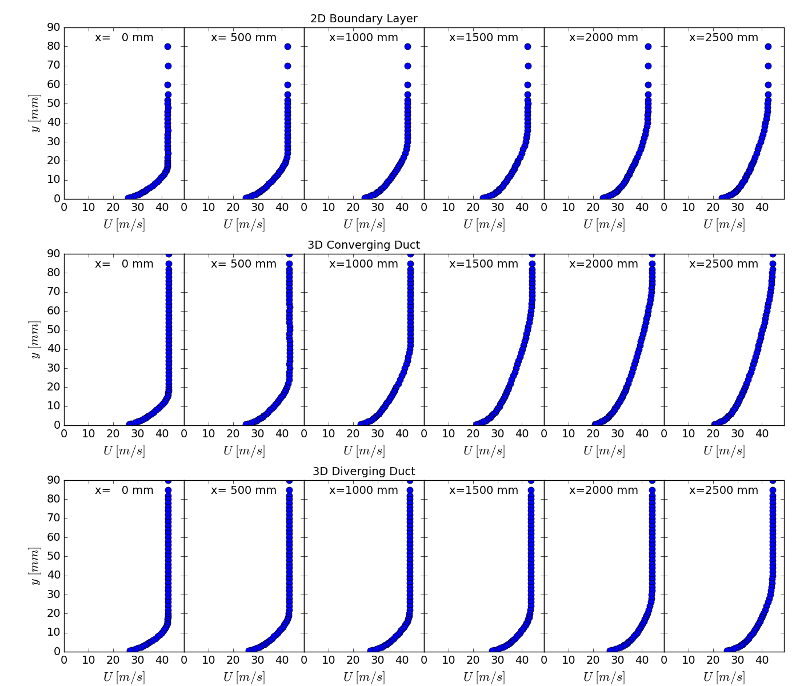
The graphs below show mean velocity profiles at selected streamwise locations along the duct centreline for the three cases.
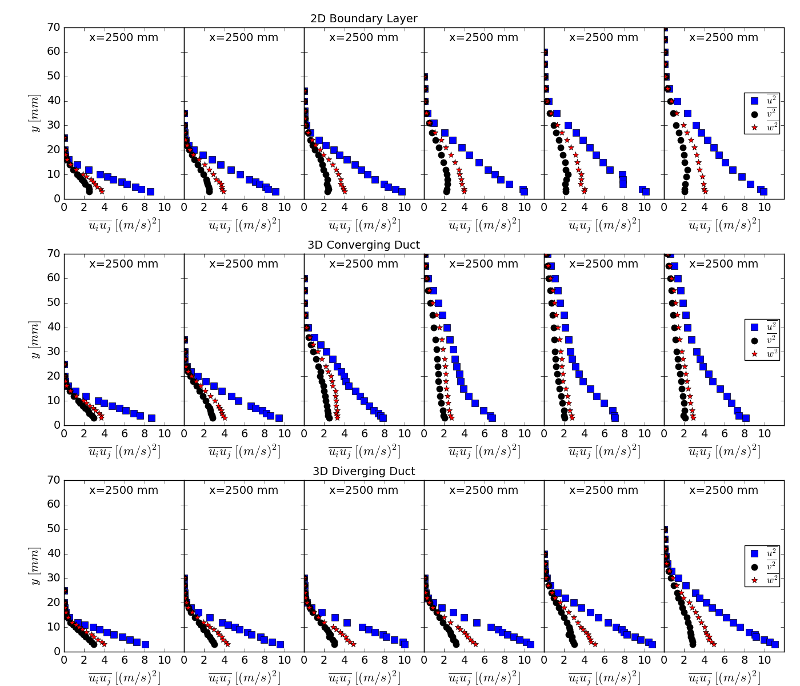
The graphs below show normal Reynolds stress profiles at selected streamwise locations along the duct centreline for the three cases.
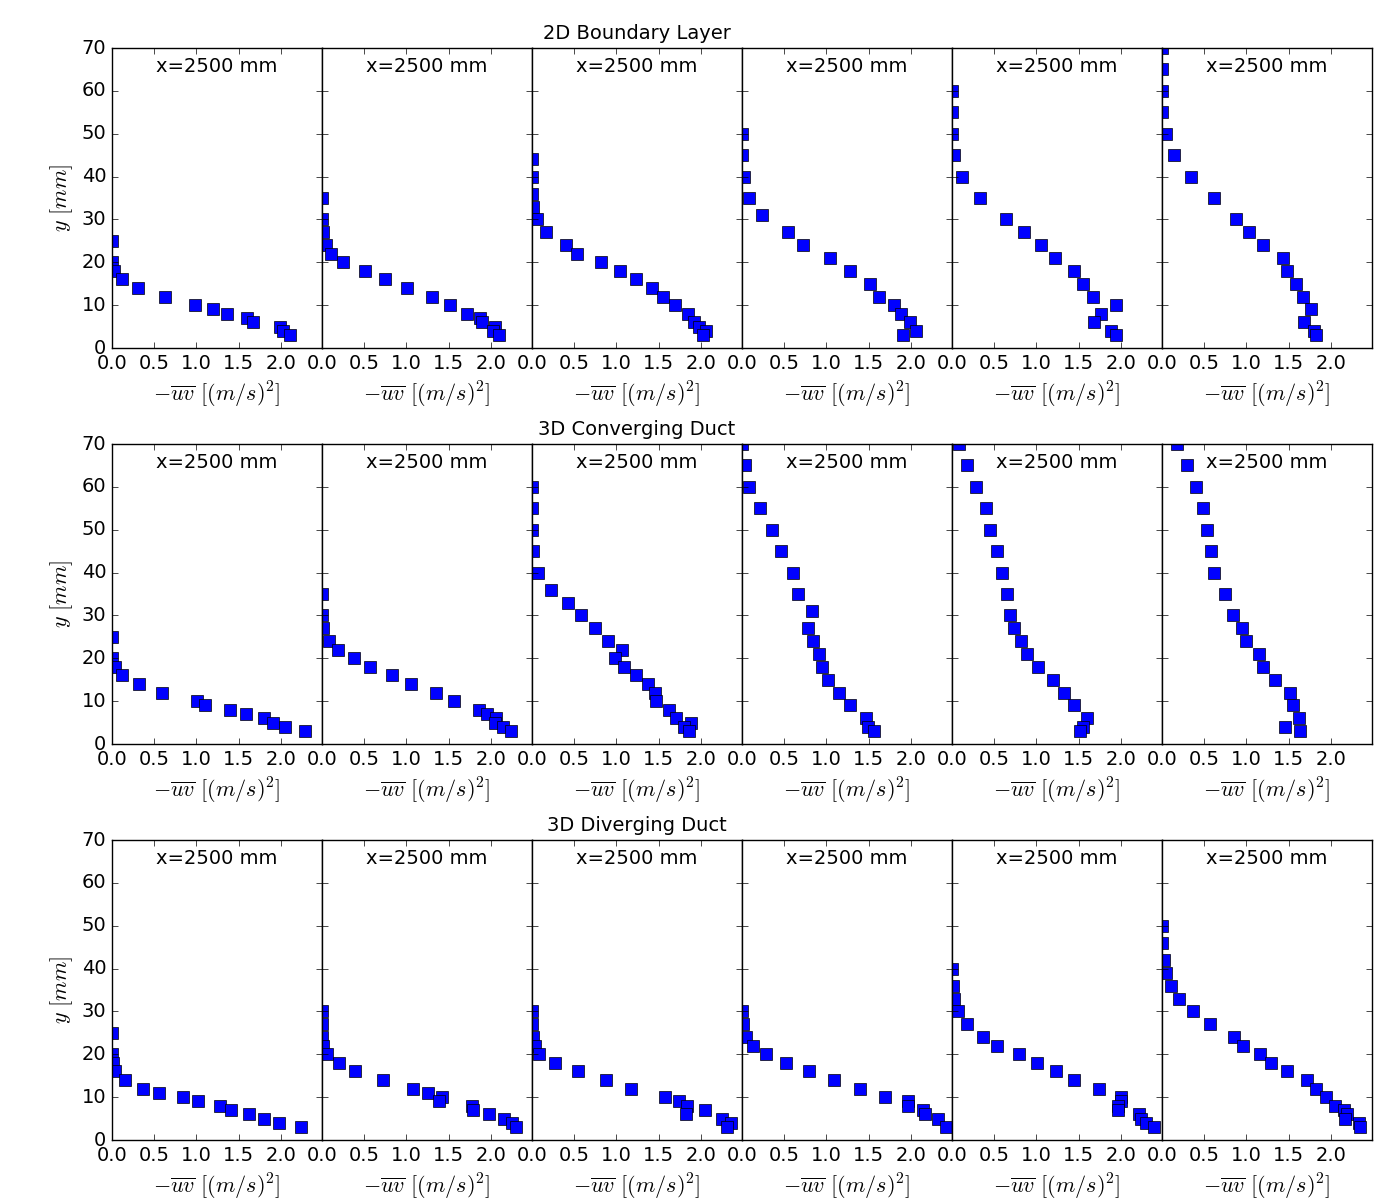
The graphs below show Reynolds shear stress profiles at selected streamwise locations along the duct centreline for the three cases.
