Upslope and Vertical Convective Boundary Layer
Sample Data Plots
The plots below show profiles of the mean velocity and temperature for both slope angles at selected times during the simulation, demonstrating that an essentially steady state situation is arrived at.
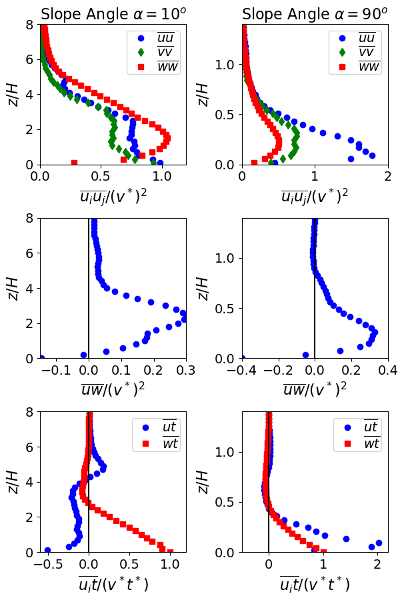
The plots below show profiles of the Reynolds stresses and turbulent heat fluxes for both slope angles once steady state conditions have been achieved.

