Flow around Surface-Mounted Cubical Obstacle
Sample Data Plots
The plot below shows mean velocity vectors on the geometry centreline.

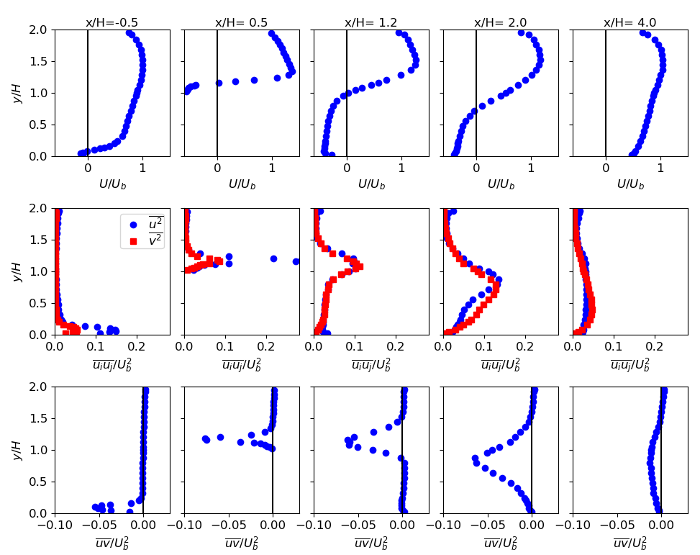
The plots below show profiles of the mean \(U\) velocity, and Reynolds stress components
at selected locations along the geometry centreline.
