Flat Plate Transitional Boundary Layers
Sample Data Plots
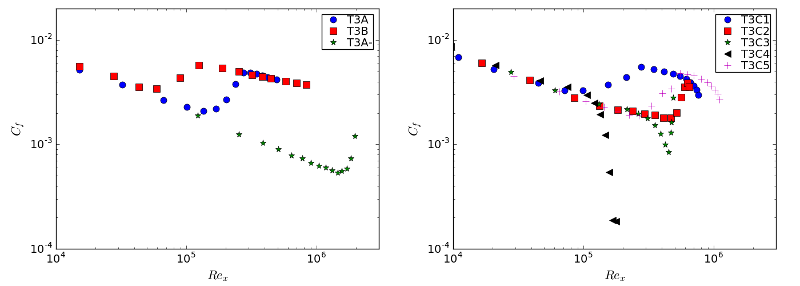
The graphs below show the skin friction coefficient development along the plate (left hand graph for aero-pressure-gradient cases, right hand graph for the variable pressure gradient cases).
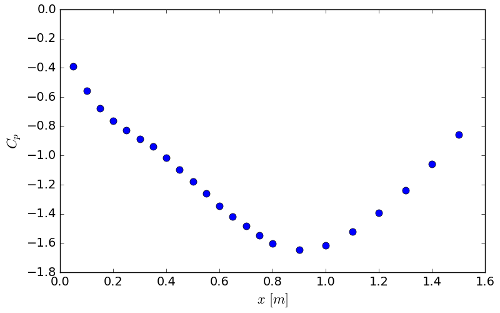
The graph below shows the \(C_p\) variation for the variable pressure gradient cases.
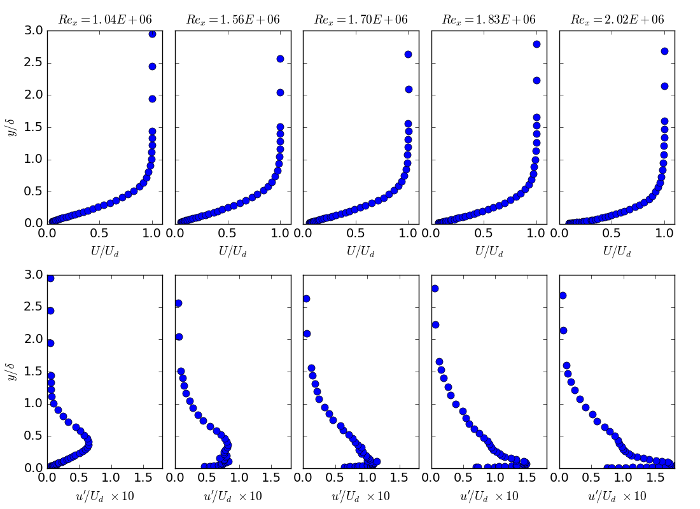
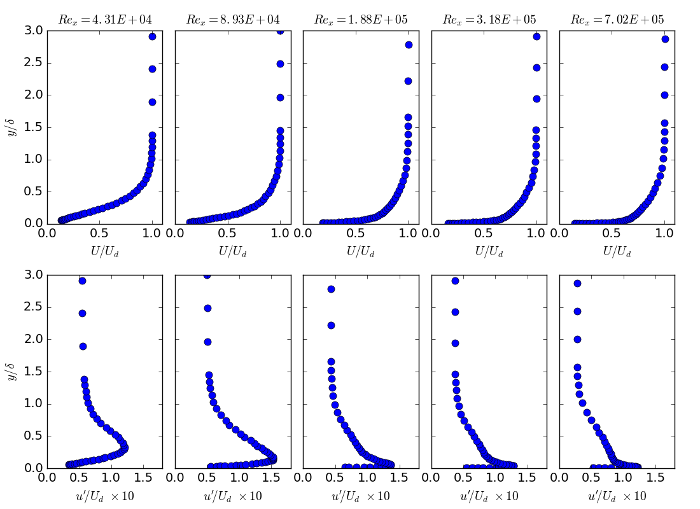
The graphs below show profiles of mean velocity and streamwise rms fluctuations at selected locations along the plate for the T3A- case.
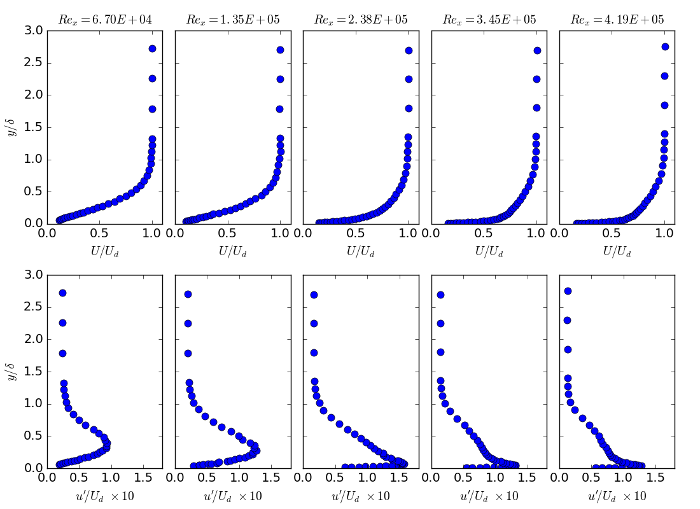
The graphs below show profiles of mean velocity and streamwise rms fluctuations at selected locations along the plate for the T3A case.
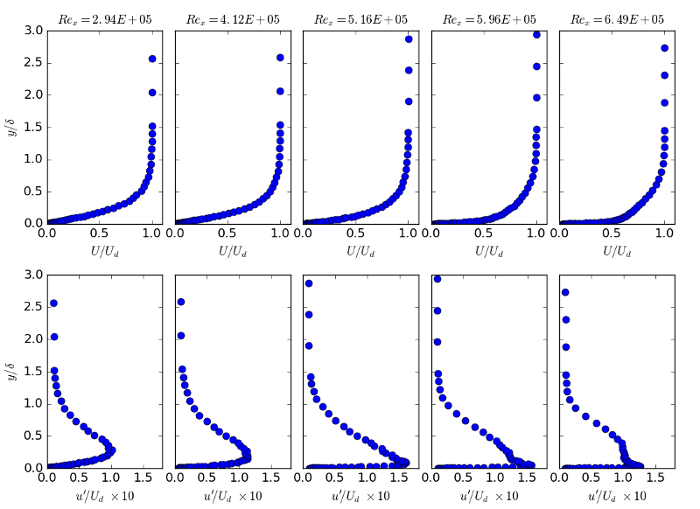
The graphs below show profiles of mean velocity and streamwise rms fluctuations at selected locations along the plate for the T3B case.
The graphs below show profiles of mean velocity and streamwise rms fluctuations at selected locations along the plate for the T3C2 case.
