Airfoil Boundary Layer and Wake
Sample Data Plots
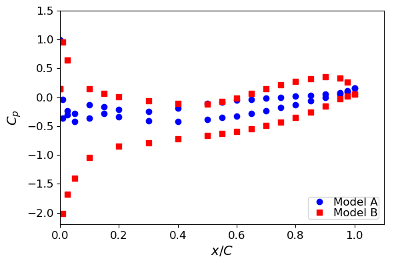
The plot below shows the surface pressure coefficient distribution around the two airfoil models.
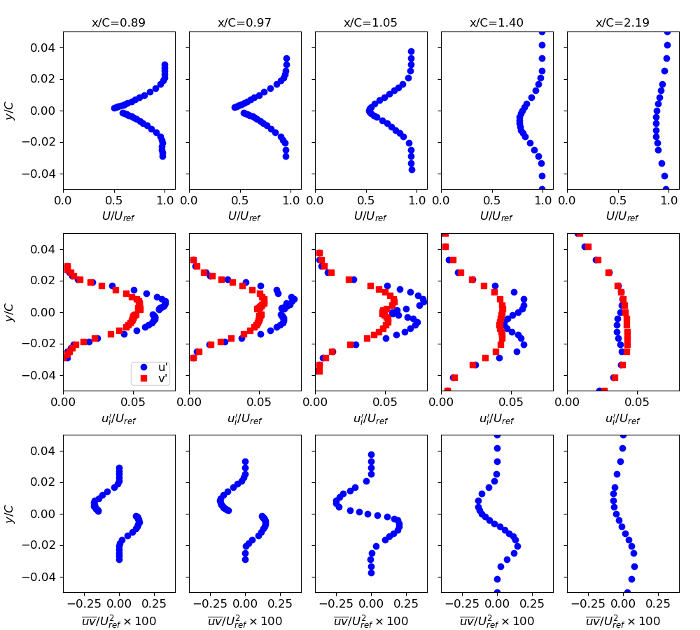
The plots below show mean velocity and Reynolds stress profiles at five locations (two before the trailing edge, three in the wake) for Model A.
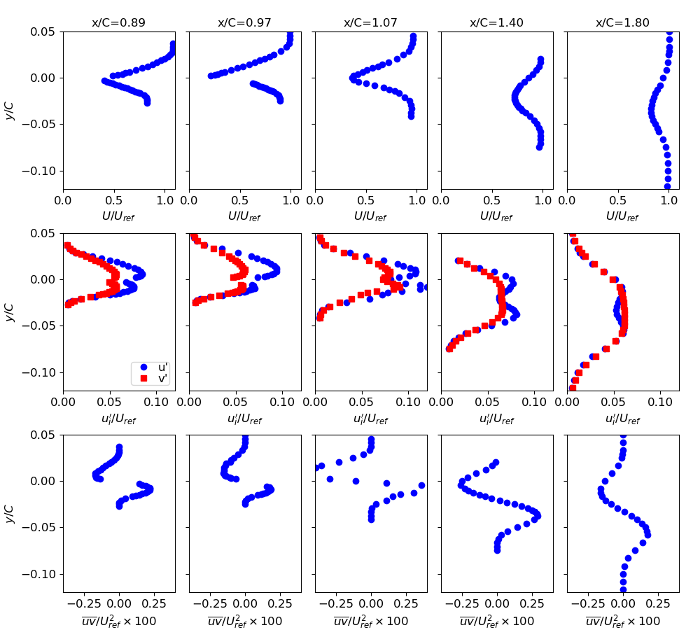
The plots below show mean velocity and Reynolds stress profiles at five locations (two before the trailing edge, three in the wake) for Model B.


