Boundary Layer in a S-Shaped Channel
Sample Data Plots
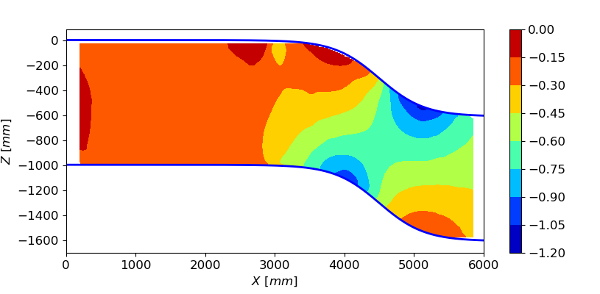
The plot below shows contours of the wall surface pressure coefficient
upstream and around the bend section.

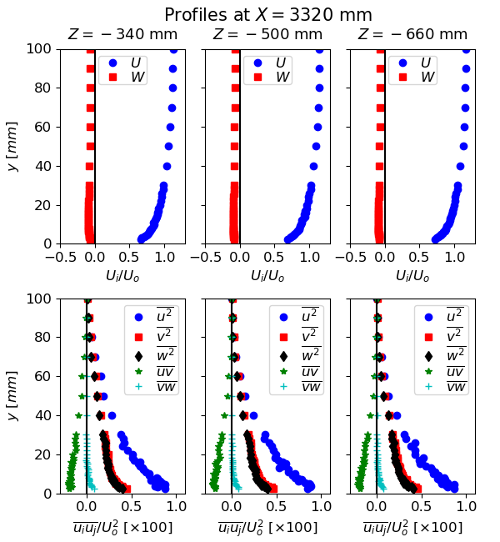
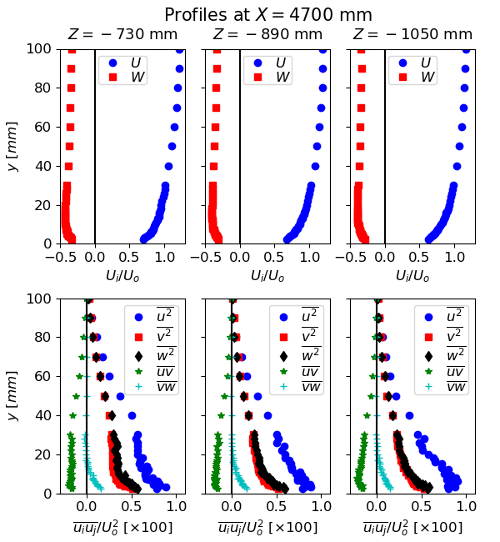
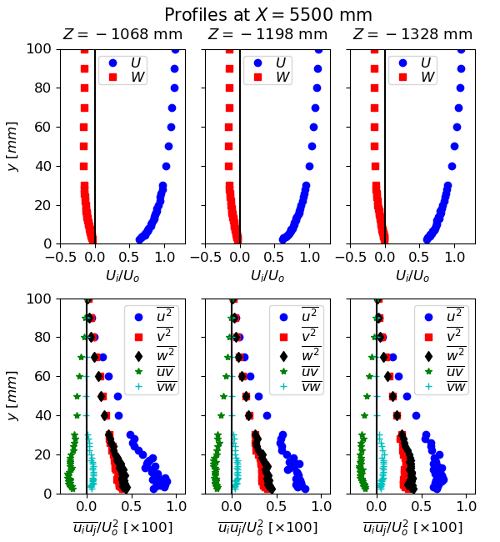
The plots below show profiles of the mean velocities and Reynolds stresses
at selected cross-stream locations (\(Z\)) and streamwise distances (\(X\)) along the duct.


