Flows over 3D and 2D Hills
Sample Data Plots
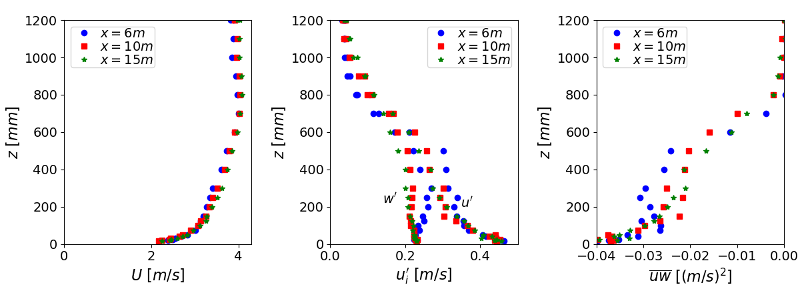
The plots below show profiles of the mean U velocity, rms velocities and Reynolds shear stress at three locations along the flat plate.
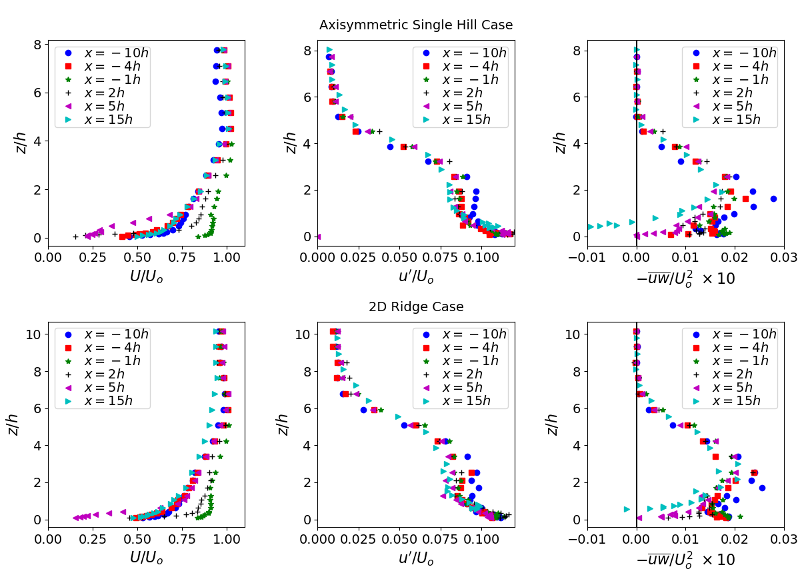
The plots below show profiles of the mean U velocity, rms u′ velocity and Reynolds shear stress at selected streamwise locations in the axisymmetric hill and 2D ridge cases.
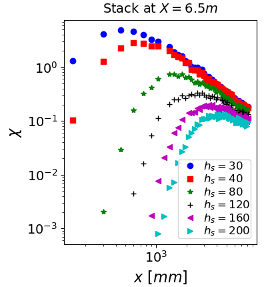
The plot below shows the distribution of non-dimensional surface concentration levels (χ=CU∞h2/Q where Q is the tracer volumetric flow rate) for the flat plate case from a selection of tracer source stack heights.
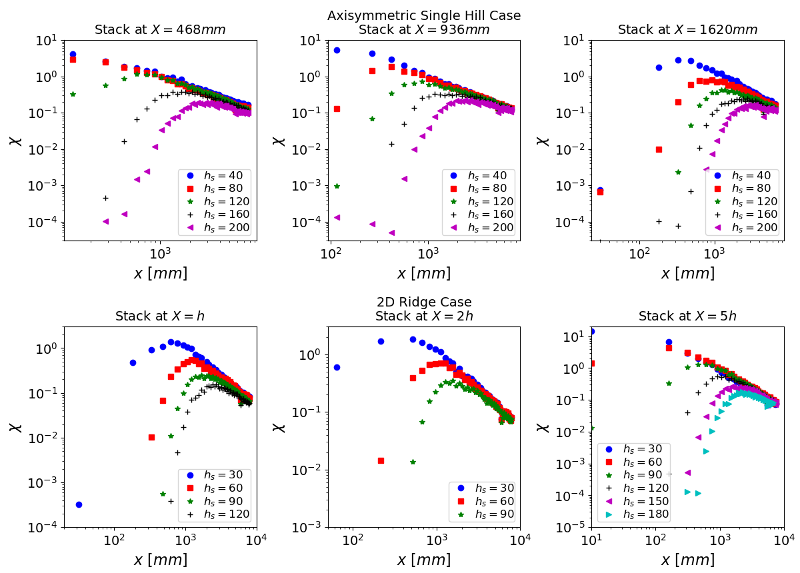
The plots below show the distribution of non-dimensional surface concentration levels (χ=CU∞h2/Q where Q is the tracer volumetric flow rate) for the axisymmetric hill and 2D ridge cases from a selection of tracer source stack locations and heights.


