Turbulent Stokes Boundary Layer
Sample Data Plots
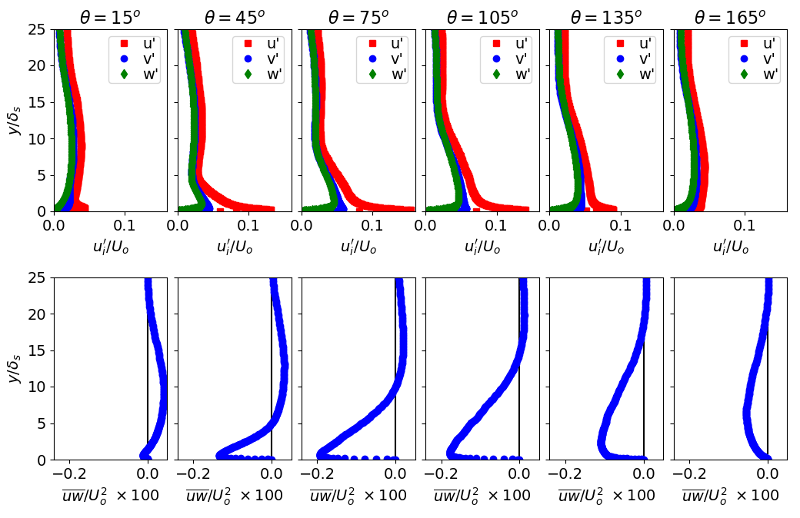
The plots below show profiles of the phase-averaged rms \(u'\), \(v'\) and \(w'\) velocities, and
the shear stress \(\overline{uw}\), across the boundary layer at a selection of phase angles
through the cycle.
