Normally Impinging Jet from a Circular Nozzle
Sample Data Plots
The plots below show profiles of the mean velocity and second moments (plotted against distance from the impingement wall) at a selection of radial locations for the H/D=2, Re=23000 case.
The plots below show profiles of the mean velocity and second moments (plotted against distance from the impingement wall) at a selection of radial locations for the H/D=2, Re=70000 case.
The plots below show profiles of the mean velocity and second moments (plotted against distance from the impingement wall) at a selection of radial locations for the H/D=6, Re=70000 case.
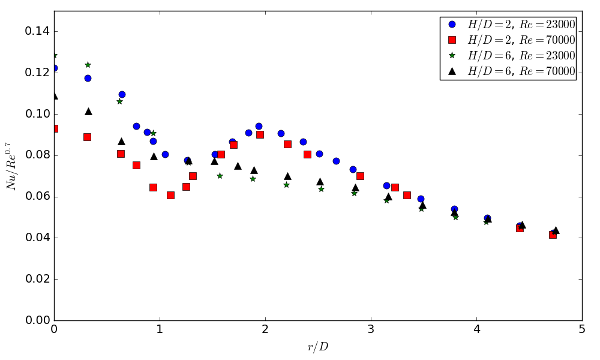
The plot below shows the distribution of Nusselt number along the impingement wall for all four cases.


