Flow over Isolated 2D Valley
Sample Data Plots
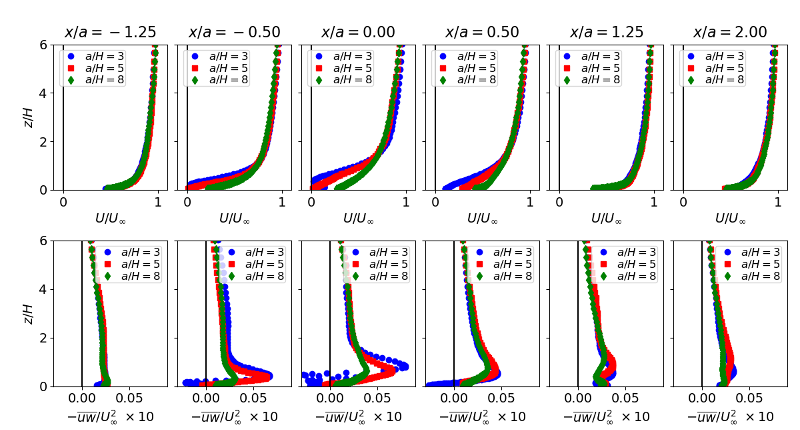
The plots below show profiles of the mean U velocity and Reynolds shear stress
at selected streamwise locations for the three valley geometries.

The plots below show profiles of the rms fluctuating velocities u′ and w′
for the a/H=3 valley case.
