Plane Mixing Layer
Sample Data Plots
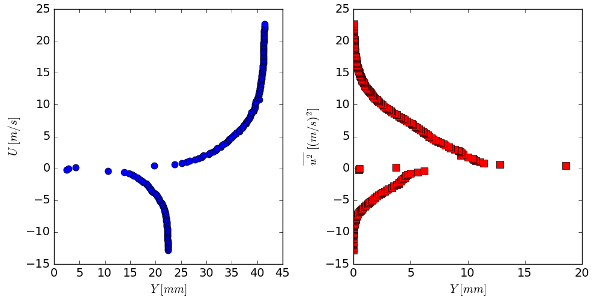
The plots below show the profiles of mean and rms streamwise velocity just downstream of the splitter plate.
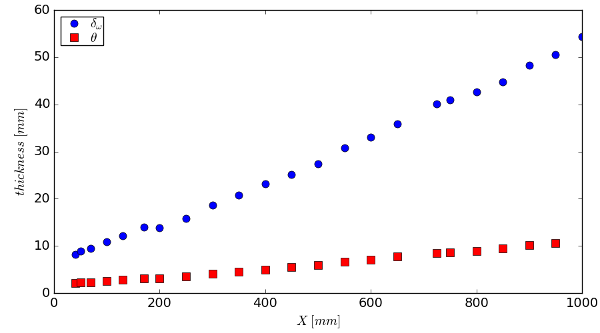
The plots below show the development of the vorticity thickness and momentum thickness of the mixing layer along the channel.
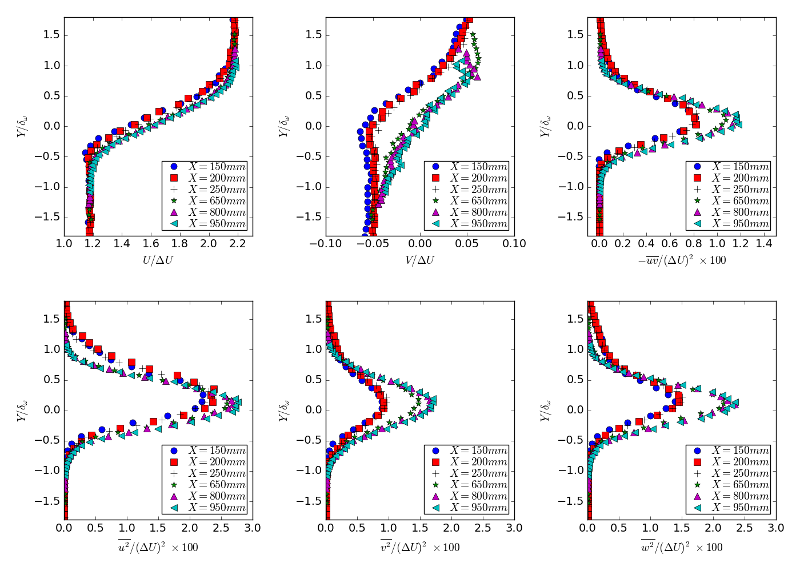
The plots below show profiles of the normalized mean velocities and Reynolds stresses at locations \(X=150\), \(200\), \(250\), \(650\), \(800\) and \(950\) mm downstream of the splitter plate.


