Circular to Rectangular Transition Duct
Sample Data Plots
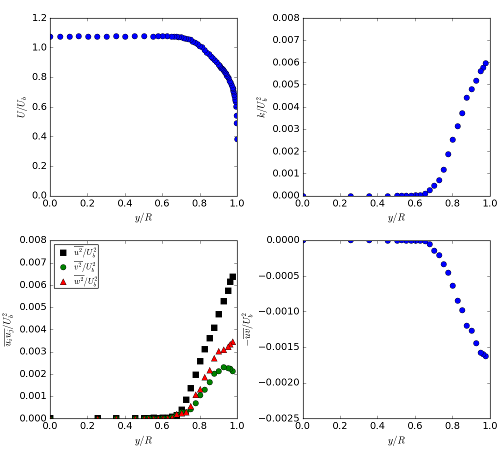
The plots below show radial profiles at the inlet section, \(x/D=-0.5\) of angular positions around the bend.
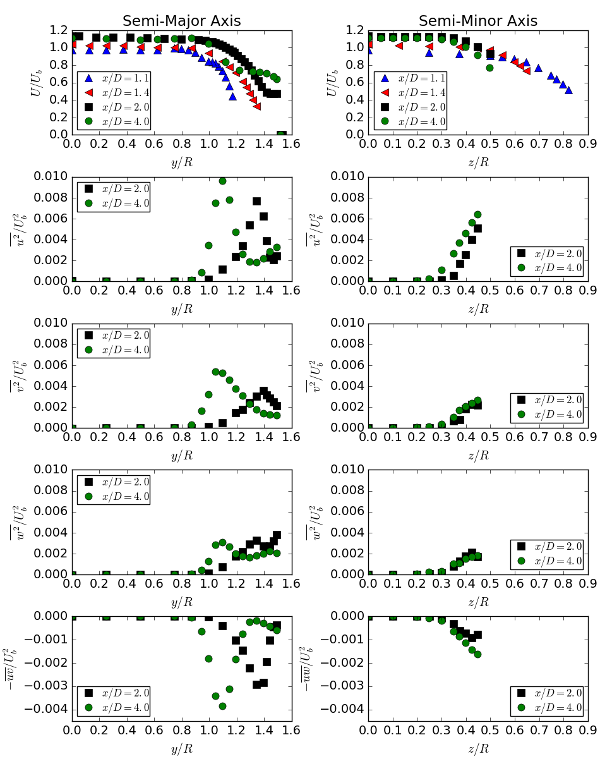
The plots below show profiles along the semi-major and semi-minor axes at the measurement locations \(x/D=1.1\), \(1.4\), \(2.0\) and \(3.0\).
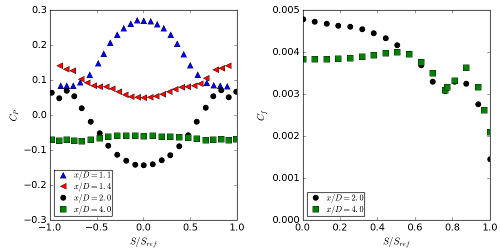
The plots below show the distribution of \(C_P\) and \(C_f\) around the duct circumference at \(x/D=2.0\) and \(4.0\).


