Pipe Constriction
Sample Data Plots
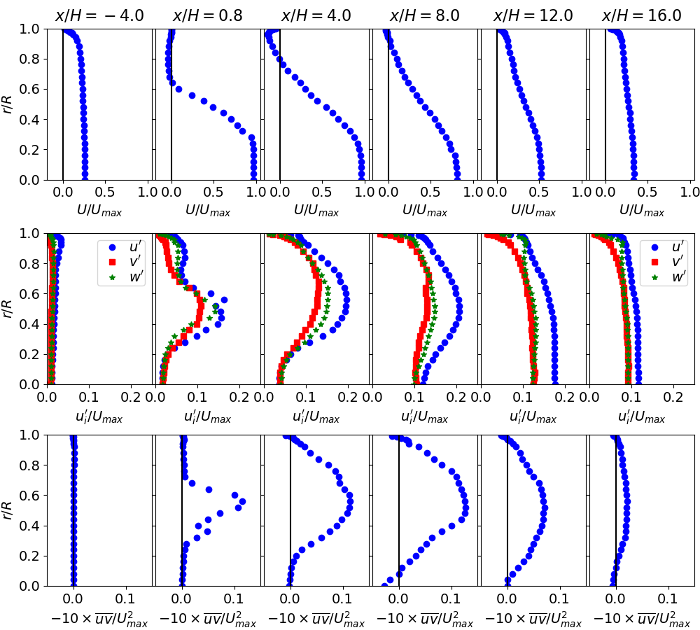
The plots below show profiles of streamwise velocity, rms velocity fluctuations, and Reynolds shear stress at selected streamwise locations for the L/d=1 case.
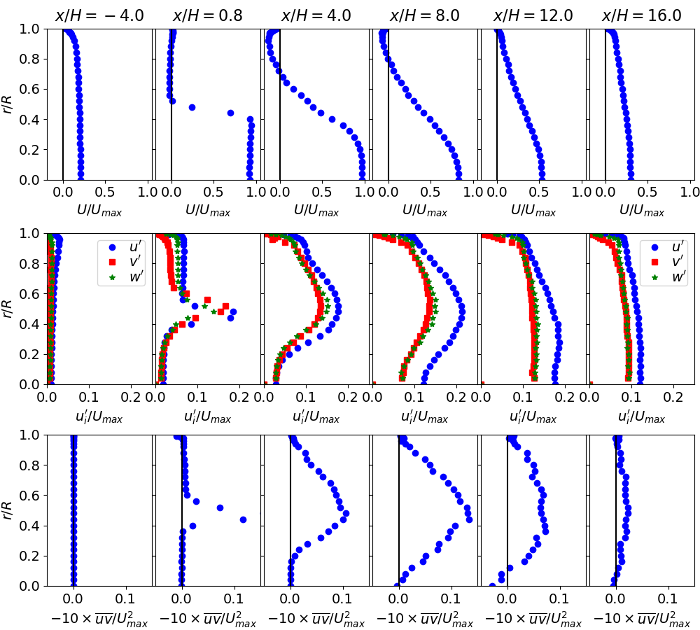
The plots below show profiles of streamwise velocity, rms velocity fluctuations, and Reynolds shear stress at selected streamwise locations for the L/d=0.04 case.

