Table of Contents
Unsteady Boundary Layer
Experiments by Brereton, Reynolds, Jayaraman
Description
Developing turbulent boundary layer responding to a forced sinusoidal free stream unsteadiness. 2D flow with constant temperature.
Geometry of the Computational Domain
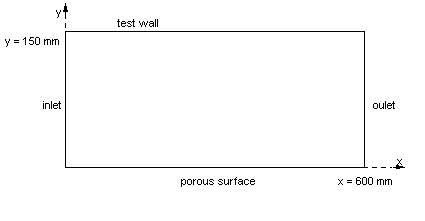
The test-section is 600 mm long and 150 mm high. The boundary layer of interest develops on the top wall. The bottom wall is porous to allow outflow through it (see figure 1).
Flow Characteristics
The response of a developing turbulent boundary layer to a forced free stream unsteadiness is studied.
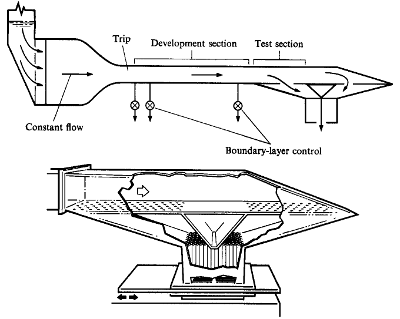
Local modulations of the main stream beyond a turbulent flat plate boundary layer which has developed under the conditions of steady, two-dimensional, constant pressure flow are imposed. The oscillations are achieved via a sliding (motor-driven) plate which controls the flow through the porous surface (see figure 2). The arrangement is designed to ensure that the free stream velocity oscillates about its mean value so that, during any cycle of the flow, the mean streamwise pressure gradient is positive and its lowest momentary value (no flow through the bottom surface) corresponds to a constant pressure flow. The time dependence of the phase-average mainstream velocity is of the form: \( \langle U_{\infty} \rangle = U_o(1-A) + U_oA cos(\omega t)\) where \(U_{\infty}\) is the local mean free stream velocity, \(U_o\) the steady free stream velocity at inlet and \(A\) the local amplitude of oscillation. The flow exiting the porous surface outlet causes a nearly linear decrease in the free stream velocity along it: the value of \(\partial (\langle U_{\infty} \rangle/U_o)/\partial x\) is constant in space (but time dependent). The amplitude \(A\) is reported to vary linearly along the test section, taking a maximum value of around 0.2 at the exit. The data provided here is for a forcing frequency of 2 Hz.
The measurements largely exhibit an insensitivity of the mean turbulence quantities to the imposed sinusoidal disturbances.
Flow Parameters
Water with:
- kinematic viscosity \(\nu = 1.1 \times 10^{-6}\) m2/s
- temperature 16.7oC
- free-stream velocity at inlet \(U_o = 0.74\) m/s
Inflow Conditions
On the top wall, at station \(x_o\) (\(x=0\)), the boundary layer is turbulent and two-dimensional after being developed under constant pressure conditions along a distance of 2 m. Its features are:
- momentum-thickness Reynolds number: 3190
- boundary layer thickness (using Coles' function) 39.9 mm
- displacement thickness \(\delta^* = 6.8\) mm
- momentum thickness \(\theta = 4.7\) mm
- shape factor \(H = 1.44\)
- friction coefficient \(C_f = 3.02 \times 10^{-3}\)
- Free-stream turbulence level: 0.2%
Experimental Details
Velocity measurements using a two-colour LDV system.
The triple decomposition is used to describe the time-dependent, turbulent behaviour of the dependent variables. The time average value \(\overline{f}\) of the variable \(f\) is calculated over a long period of time and the phase or ensemble average \(\langle f \rangle\) is calculated over a cycle so that the instantaneous value is given by \( \overline{f} + \tilde{f} + f' = \langle f \rangle + f'\).
Measurement Errors:
\(\delta(\overline{uv})/\overline{uv} = 7\%\) (95% confidence level)
Available Measurements
The following measurements are provided at three \(x\) locations, \(X'=0.0\), \(0.45\) and \(0.63\) (where \(X'\) denotes the fraction of the distance along the test section) for the top wall boundary layer:
- Time average profiles for \(y\) ranging from 0.076 mm to 80 mm of:
- First order moments: \(U\), \(V\)
- Second order moments: \(\overline{u^2}\), \(\overline{v^2}\), \(\overline{uv}\)
Sample plots of the quantities are available.
The data can be downloaded as compressed archive files from the links below, or as individual files by selecting those required from the tables.
| \(X'\) | Data file |
|---|---|
| 0.0 | ubl-prfs-x00.dat |
| 0.45 | ubl-prfs-x45.dat |
| 0.63 | ubl-prfs-x63.dat |
Main References
- Brereton, G.J., Reynolds, W.C., Jayaraman, R. (1990). Response of a turbulent boundary layer to sinusoidal free-stream unsteadiness. J. Fluid Mech. Vol. 221, pp. 131-159.
- Brereton, G.J., Reynolds, W.C., Jayaraman, R. (1987). Experimental study of the fluid mechanics of unsteady turbulent boundary layers. Stanford Report TF-29.
Indexed data:
| case005 (dbcase, semi_confined_flow) | |
|---|---|
| case | 005 |
| title | Unsteady Boundary Layer |
| author | Brereton, Reynolds, Jayaraman |
| year | 1988 |
| type | EXP |
| flow_tag | unsteady, 2dbl |

