Table of Contents
Sink-Flow Boundary Layer
DNS by Spalart
Description
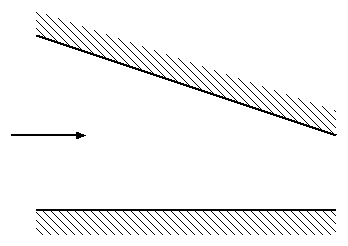
The data are from direct numerical simulations of sink-flow boundary layers, with acceleration parameters \(K=(\nu/U_{\infty}^2)(dU_{\infty}/dx)\) between \(1.5\times 10^{-6}\) and \(2.75\times 10^{-6}\). The three-dimensional, time-dependent Navier-Stokes equations are solved numerically using a spectral method.
The flow was assumed to be statistically steady, and self-similar. A multiple-scale approximation and periodic conditions are applied to the fluctuations. The turbulence is studied using instantaneous and statistical results.
Good agreement with the experiments of Jones & Launder (1972) is observed.
The numerical method, described by Spalart (l984a,b, 1986), was designed specifically for incompressible boundary layer flows with periodic conditions in the directions parallel to the plate. It is based on Leray's weak formulation of the incompressible Navier-Stokes equations. It is spectral in the three space directions and second-order accurate in time.
The governing equations are based on the incompressible Navier-Stokes equations and the method of multiple scales. The equations used here are a special case from the ones used by Spalart & Leonard (1986). They are somewhat simpler because the sink flow obeys a single similarity law across the entire boundary layer, while general equilibrium boundary layers contain a 'wall' layer and an 'outer' or 'defect' layer.
Simulation Details
The numerical resolution in all the simulations is (\(170 \times 30 \times 85\)) spectral modes in the (\(x\), \(y\), \(z\)) directions. Thus there are \(8.7\times 10^5\) degrees of freedom. These are the 'true' degrees of freedom that remain after the continuity constraint has been applied, and do not include the pressure.
The number of collocation points is 3/2 times the number of modes in each direction.
The periods \(\Lambda_x\) and \(\Lambda_z\) are \(125\delta^*\) and \(25\delta^*\); they were chosen large enough for the velocity two-point correlation to be close to 0 at a separation distance of about half a period.
The spacing between collocation points in a typical case (eg at \(K = 2.5\times 10^{-6}\)) is about 16 and 6 wall units (\(\nu/u_{\tau}\)) in the \(x\) and \(z\) direction respectively. In the \(y\) direction the first three collocation points are at 0.09, 0.45, and 1.1 wall units from the wall. The validity of the multiple-scale argument can be estimated from the value of the ratio \(\delta/X_o\) of about 0.012.
Since only the long-time Equilibrium State of the flow is of interest the initial condition is of little importance and is chosen to minimise the cost of computing transient regimes. Most often the final state of a simulation' at another value of \(K\) is taken as the initial state for a new simulation. The first boundary layer was started with large-amplitude random disturbances. The transient regime is not included in the statistical sample used for the results presented here. Averages are taken over the \(x\) and \(z\) directions, and over time. The spatial sample is sufficient for the mean quantities and the Reynolds stresses, but for higher-order moments, correlation and spectra, averaging in time is necessary to reduce the statistical jitter.
Errors
For low wave-numbers the numerical spectrum terminates while the experimental spectrum is still rising, which could indicate that the period 4 is not long enough. This is, however, perhaps over-emphasised by the logarithmic co-ordinates; the energy contained in that part of the spectrum is small. One should also keep in mind that Jones & Launder (1972) measured time spectra, and applied Taylor's hypothesis using the local mean velocity to obtain spatial spectra. This hypothesis is probably less reliable for low wave-numbers, since the translation of large structures is not closely related to the local mean velocity. The disagreement in the high-wave number range, \(\nu k_x/U\) around \(10^{-3}\), is more significant. The computed spectra do not collapse. The numerical spectrum is of course limited, but the drop from its peak to its tail is more than three orders of magnitude. Thus the resolution seems adequate. Physically, one would not expect the spectra to collapse with a \(y\) independent normalisation, because the length scales of the turbulence (for instance based on the energy or the dissipation, and the viscosity) increase away from the wall. Thus one would expect the normalised spectrum to be fuller near the wall, which is what the numerical results predict. The problem may be due to an excessive probe size in the experiment.
Available Results
The following data are provided for three values of the acceleration parameter, \(K=1.5\times 10^{-6}\), \(2.5\times 10^{-6}\) and \(2.75\times 10^{-6}\):
- Profiles of mean velocity, \(U\), and Reynolds stresses, \(\overline{u^2}\), \(\overline{v^2}\), \(\overline{w^2}\), \(\overline{uv}\).
- Budgets for the second moments, \(\overline{u^2}\), \(\overline{v^2}\), \(\overline{w^2}\), \(\overline{uv}\), and \(k\).
Sample plots of selected quantities are available.
The data can be downloaded as compressed archives from the links below, or as individual files.
| Case | File |
|---|---|
| \(K=1.5\times 10^{-6}\) | sink-k-150.dat |
| \(K=2.5\times 10^{-6}\) | sink-k-250.dat |
| \(K=2.75\times 10^{-6}\) | sink-k-275.dat |
References
- Jones, W.P., Launder, B.E. (1972). Some properties of sink-flow turbulent boundary layers. J. Fluid Mech., Vol. 56, pp. 337-351.
- Spalart, P.R. (1984a). A spectra method for external viscous flows. Contemp. Maths., Vol. 28, pp. 315-335.
- Spalart, P.R. (1984b). Numerical simulation of boundary layer transition. Proc. 9th Int. Conf. on Num. Meth. in Fluid Dyn. (eds. S. Soubbarameyer & J.P. Boujot), Paris.
- Spalart, P.R. (1986). Numerical study of sink-flow boundary layers. J. Fluid Mech., Vol. 172, pp. 307-328.
- Spalart, P.R., Leonard, A. (1986). Direct numerical simulations of equilibrium turbulent boundary layers. Proc. 5th Symp. on Turbulent Shear Flows (eds. F.J. Durst, B.E. Launder, F.W. Schmidt, J.H. Whitelaw), Springer.
—-
Indexed data:
| case021 (dbcase, semi_confined_flow) | |
|---|---|
| case | 021 |
| title | Sink Flow Boundary Layer |
| author | Spalart |
| year | 1986 |
| type | DNS |
| flow_tag | 2d, 2dbl |
