Boundary Layer with Adverse Pressure Gradient
Sample Data Plots
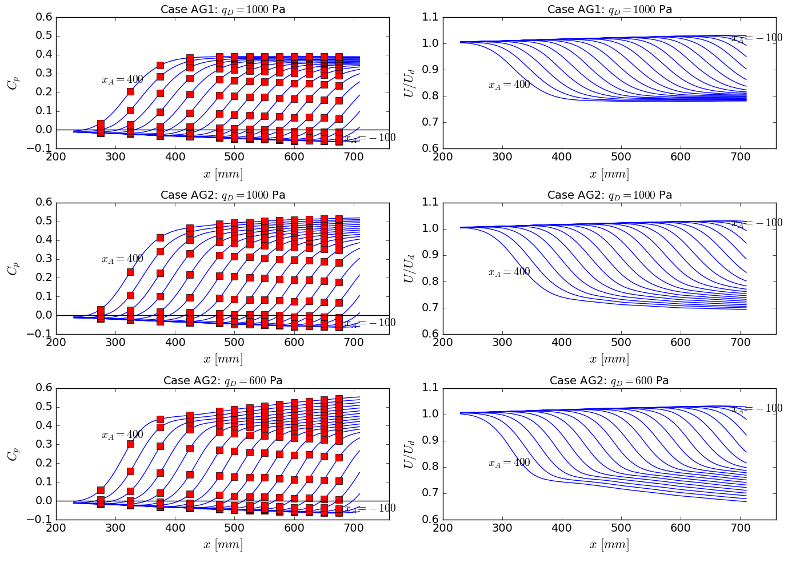
The graphs below show profiles of wall pressure coefficient, and free-stream velocity (derived from the pressure measurements) along the pipe for the three cases reported, over the range of \(x_A\) considered.
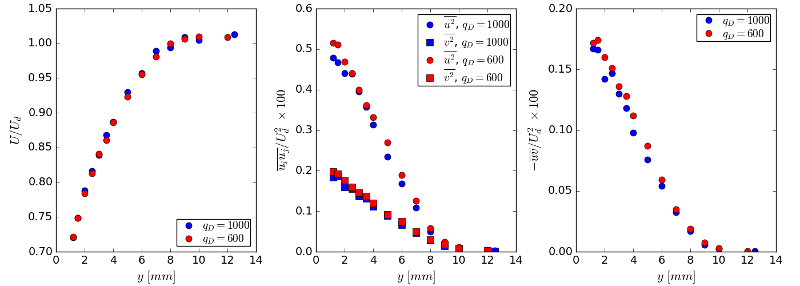
The graphs below show profiles of mean velocity and Reynolds stresses at section \(x_E\), for both values of the dynamic pressure \(q_D\).
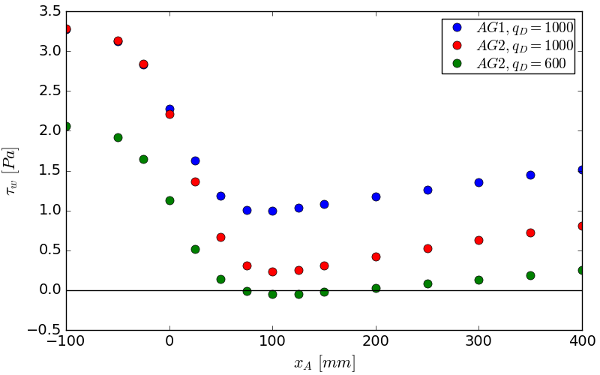
The graph below shows the wall shear stress at \(x_M\) as the location of \(x_A\) is varied, for the three cases reported.
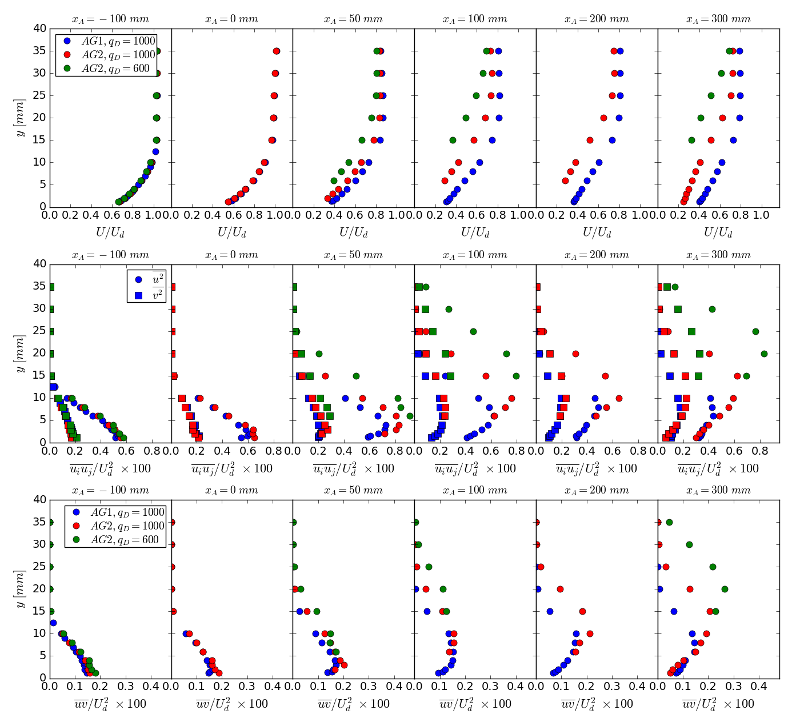
The graphs below show profiles of mean velocity and Reynolds stresses at \(x_M\) as the location of \(x_A\) is varied, for the three cases reported.


