Boundary Layer in and Downstream from Convex Curvature
Sample Data Plots
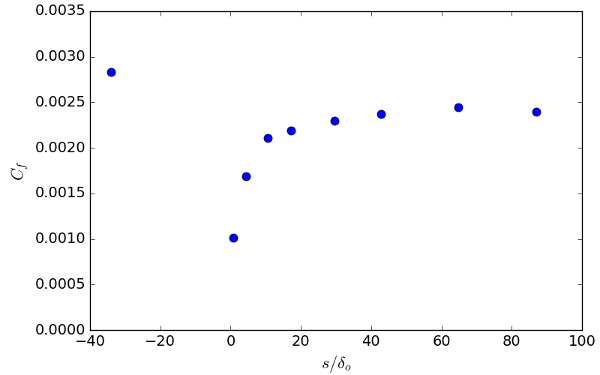
The graph below shows the skin friction coefficient development along the wall.
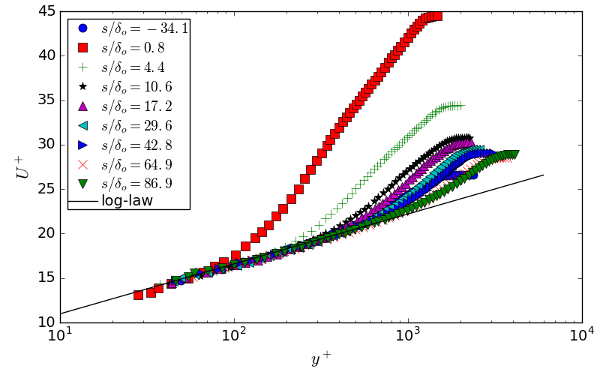
The graph below show mean velocity profiles upstream and downstream of the curved section, compared to the standard log-law.
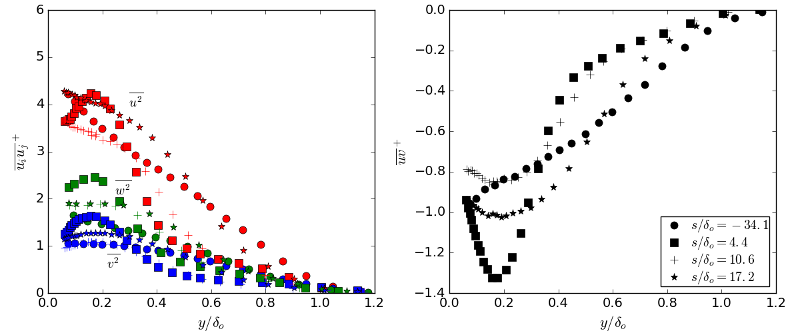
The graph below show Reynolds stress profiles upstream and in the near-field downstream region of the curved section.
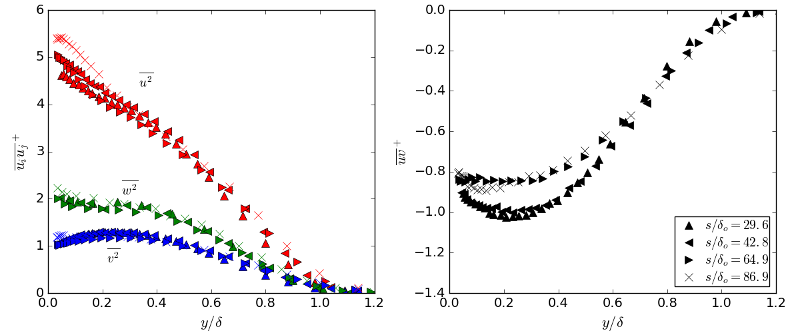
The graph below show Reynolds stress profiles further downstream in the recovery region.


