Time-Periodic Boundary Layer
Sample Data Plots
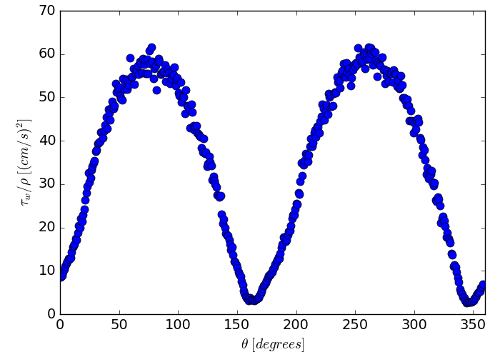
The plot below shows the variation of mean wall shear stress through the periodic cycle.

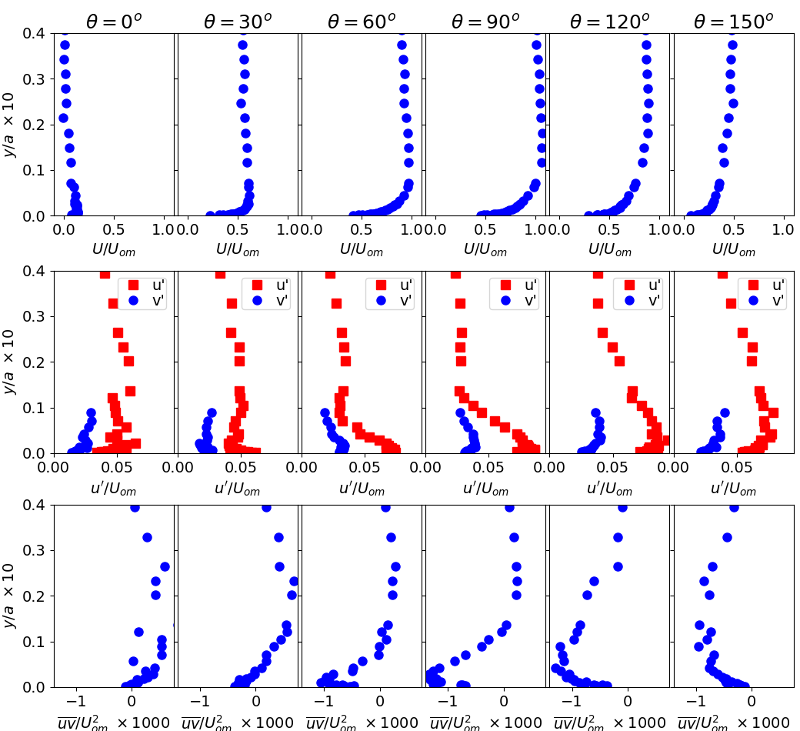
The plots below show profiles of the mean \(U\) velocity, rms \(u'\) and \(v'\), and
\(\overline{uv}\) across the boundary layer at a selection of phase times through the cycle.
