Developing Flow in a Curved Rectangular Duct
Sample Data Plots
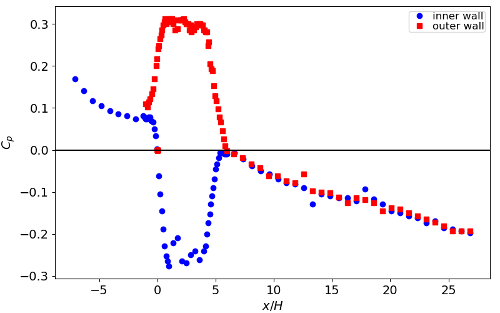
The plot below shows the wall pressure coefficient on the symmetry plane along the inner and outer walls of the duct.
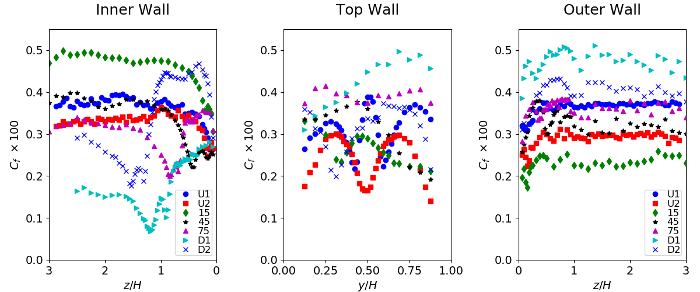
The plots below show the skin friction coefficient around the duct walls at the five measurement locations (U1, U2, 15, 45, 75, D1 and D2).
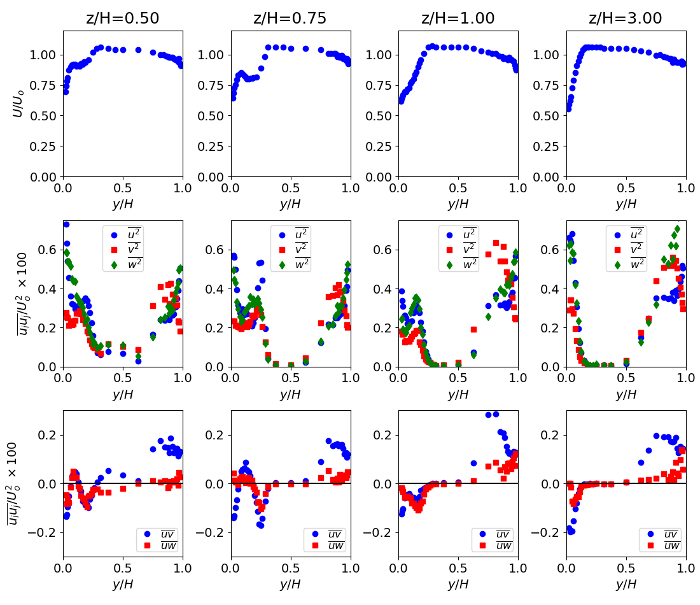
The plots below show profiles of mean \(U\) velocity and Reynolds stresses at selected \(z\) locations on the downstream plane D1.
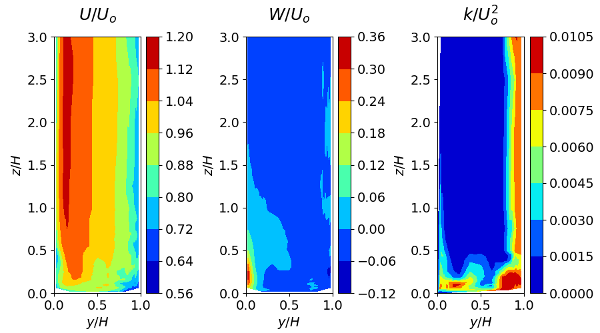
The plots below show contours of the mean \(U\) velocity, mean \(W\) velocity and turbulent kinetic energy at the 45 measurement station (half way around the bend).


