Surface Pressure in Normal Triangular Tube Arrays
Sample Data Plots
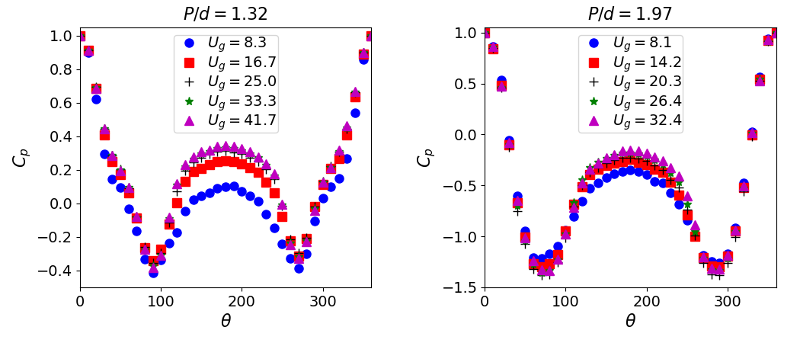
The plots below show profiles of the mean \(C_p\) distribution around the cylinder for the \(P/d=1.32\) and \(1.97\) pitch ratio cases, for a selection of inlet velocities (with zero displacement of the instrumented tube).
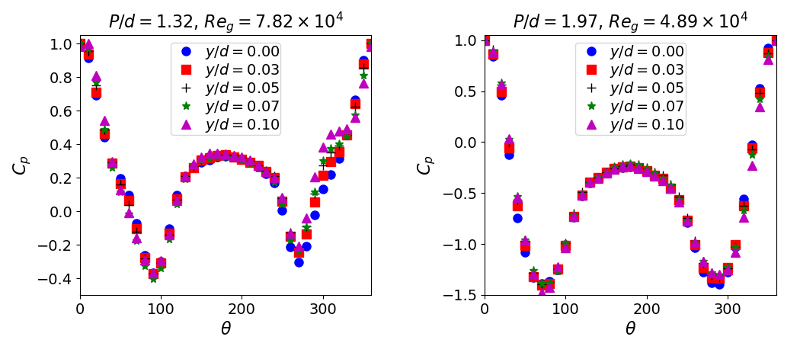
The plots below show profiles of the mean \(C_p\) distribution around the cylinder for the \(P/d=1.32\) and \(1.97\) pitch ratio cases, at a fixed inlet velocity, for a selection of displacements (\(y/d\)) of the instrumented tube.

