Viscous Boundary Layers in Turbulent Rayleigh-Bénard Convection
Sample Data Plots
The plots below show profiles of the mean and rms wall-parallel velocity, and rms wall-normal velocity, on the cylinder centreline, from the experimental measurements and DNS for both \(Ra=3\times 10^9\) and \(3\times 10^{10}\) cases.
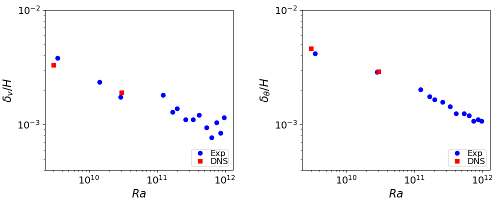
The plots below shows the variation of the dynamic and thermal boundary layers with \(Ra\) from both the measurements and DNS.

