Single-Stream Swirling Jet in Still Air
Sample Data Plots
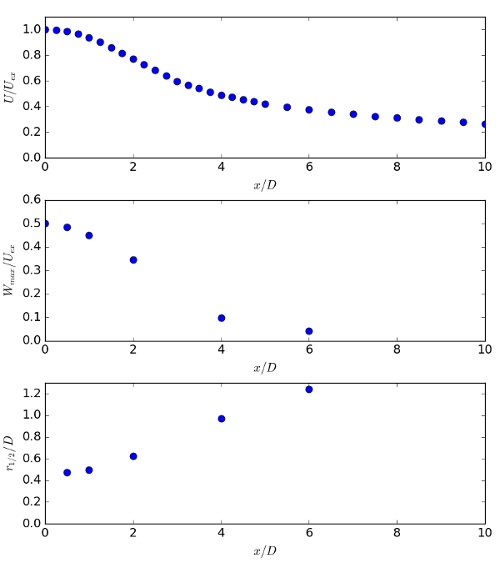
The plots below show development along the jet of the centreline velocity, maximum swirl velocity and jet halfwidth.
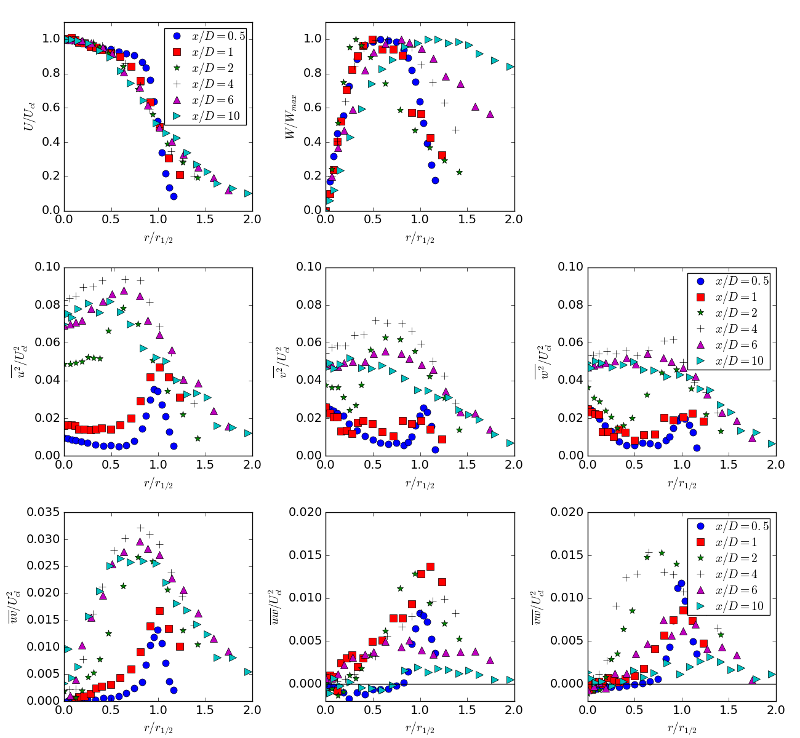
The plots below show profiles of the mean streamwise and swirl velocity components, and the Reynolds stresses, plotted against normalised distance across the jet, at the six streamwise measurement locations.

