2D Channel Flow with/without Thermal Field
Sample Data Plots
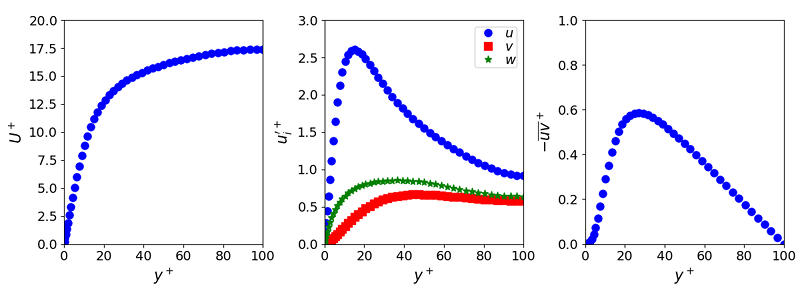
The plots below show profiles of the mean \(U\) velocity and Reynolds stress components for the \(Re_{\tau}=100\) case.
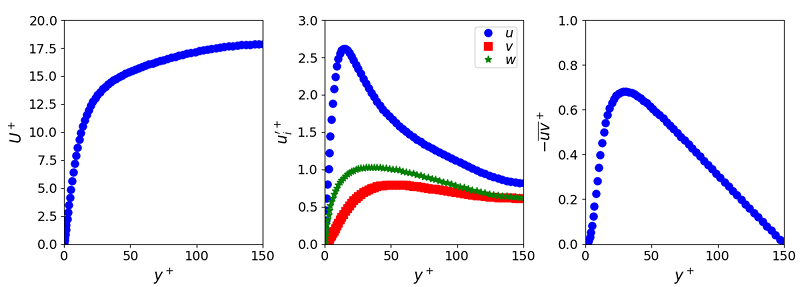
The plots below show profiles of the mean \(U\) velocity and Reynolds stress components for the \(Re_{\tau}=150\) case.
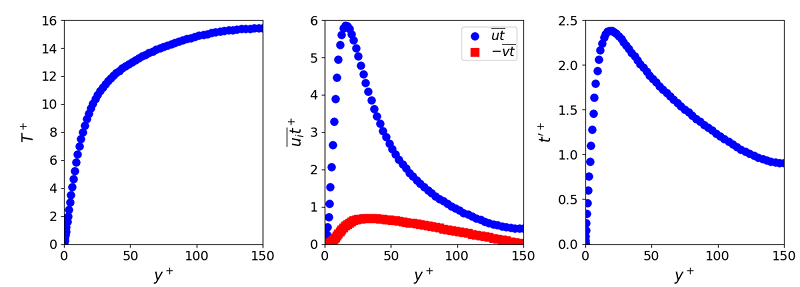
The plots below show profiles of the mean temperature, turbulent heat fluxes, and rms temperature fluctuations across the channel for \(Re_{\tau}=150\), \(Pr=0.71\).
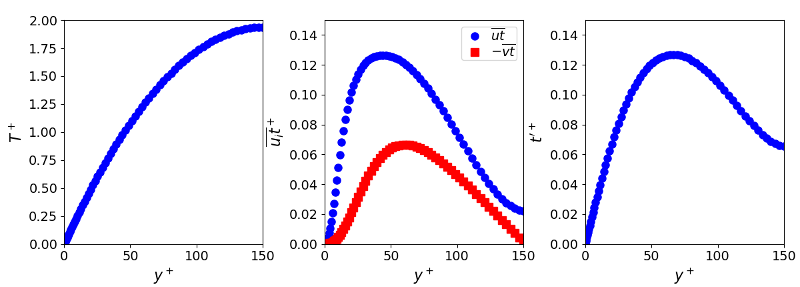
The plots below show profiles of the mean temperature, turbulent heat fluxes, and rms temperature fluctuations across the channel for \(Re_{\tau}=150\), \(Pr=0.0.25\).


