Backward-Facing Step with Uniform Normal Bleed
Sample Data Plots
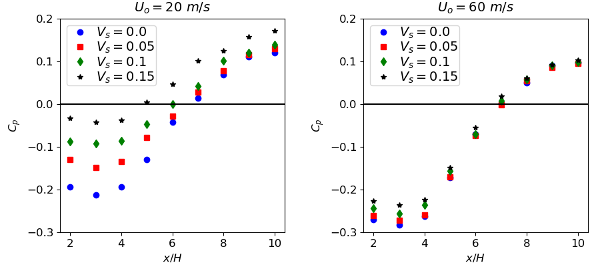
The plots below show the wall static pressure coefficient distribution for the \(U_o=20\) and \(60\) m/s cases.
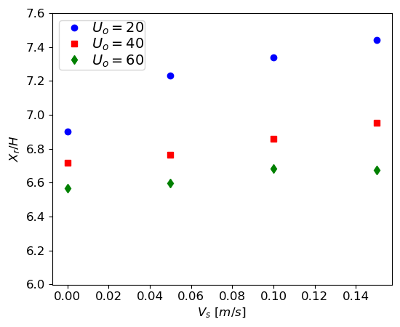
The plot below shows the normalized reattachment length for all cases.
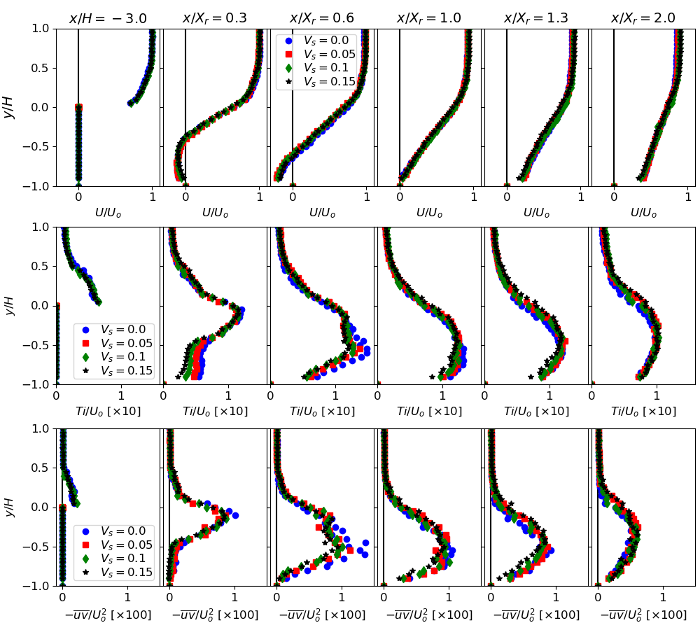
The plots below show profiles of the normalized mean velocity, turbulence intensity and Reynolds shear stress at a selection of streamwise locations for the \(U_o=20\) m/s cases.


