Pipe Constriction
Experiments by Durst and Wang
Description
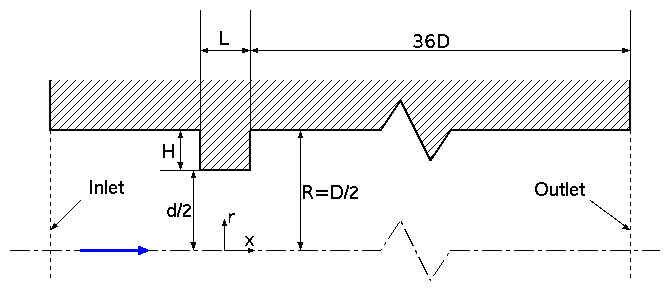
The flow through a wall-mounted constriction in a pipe was studied, with geometry shown schematically in figure 1. Refractive index matching was employed to ensure that velocity measurements could be obtained in all regions inside of measured positions. Laser-Doppler-anemometry was used to obtain quantitative velocity information.
The Reynolds number, based on constriction diameter, \(d\), and maximum velocity, \(U_{\max}\), was \(2.2\times 10^4\).
Experimental Details
Test Section and Experimental Techniques
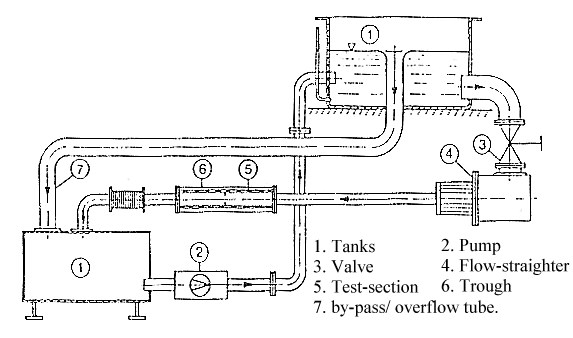
All the measurements for these experimental investigations were performed in the same closed-circuit pipe flow system employed by Durst et al.(1988), shown in figure 2. The working fluid was a mixture of two diesel oils, with a refractive index matching that of the quartz glass test section. The refractive index matching technique was used in order to prevent displacement of the measuring volume inside the test-section due to the curvature of the pipe walls. The test section comprised a 1 m long, 50mm diameter (\(D\)) quartz-glass pipe and a 25mm internal diameter (\(d\)) glass ring, located axisymmetrically in the pipe and yielding an area blockage ratio equal to 0.25. Two different lengths for this blockage are reported here, \(L=1\) mm and \(25\)mm (corresponding to \(L/d=0.04\) and \(1\), respectively). Fully developed symmetric inlet conditions were established at the entrance of the test section after a \(60 D\) entrance length and the outlet was \(36 D\) downstream of the obstacle.
 Fig. 2: Schematic of the experimental setup
The same one component LDA system used in Durst et al. (1988), employing a 15mW He-Ne laser with a forward light-scattering arrangement, was applied for velocity measurements. Signals were processed by a frequency counter (TSI Model 1990B), which operated in the continuous mode with eight cycles validation and 1% comparison error. In order to avoid the so called velocity bias, the data were sampled more than 2000 times at a regular frequency of 50Hz, with data rates ranging between 0.3 and 1.7 kHz.
Available measurements
Data available includes profiles of mean velocity and Reynolds stresses at a number of streamwise locations upstream and downstream of the pipe constriction. For the thin constriction (\(L/d=0.04\)) profiles are provided at \(x/H=-16\), \(-4\), \(-2\), \(-0.8\), \(0.04\), \(0.8\), \(2\), \(4\), \(6\), \(8\), \(10\), \(12\), \(16\), \(24\) and \(32\). For the \(L/d=1\) case profiles are provided at \(x/H=-16\), \(-4\), \(-0.8\), \(-0.04\), \(0.04\), \(0.8\), \(2\), \(4\), \(6\), \(8\), \(10\), \(12\), \(16\), and \(28\).
Velocities are normalized with \(U_{\max}\), the maximum velocity along the pipe centreline.
Sample plots of selected quantities are available.
The data can be downloaded as compressed archives from the links below, or as individual files.
| Case A (\(L/d=1\)) | Case B (\(L/d=0.04\)) | |
|---|---|---|
| Mean \(U\) velocity | ha_u.dat | hb_u.dat |
| Mean \(V\) velocity | ha_v.dat | hb_v.dat |
| Mean \(W\) velocity | ha_w.dat | hb_w.dat |
| \(\overline{u^2}\) stress | ha_uu.dat | hb_uu.dat |
| \(\overline{v^2}\) stress | ha_vv.dat | hb_vv.dat |
| \(\overline{w^2}\) stress | ha_ww.dat | hb_ww.dat |
| \(\overline{uv}\) stress | ha_uv.dat | hb_uv.dat |
| Turbulent kinetic energy, \(k\) | ha_k.dat | hb_k.dat |
References
- Durst, F., Founti, M., Wang, A.B. (1988). Experimental investigation of the flow through an axisymmetric constriction. Turbulent Shear Flows 6, (Eds. J.-C. Andre, J. Cousteix, F. Durst, B.E. Launder, F.W. Schmidt, J.H. Whitelaw), Springer Verlag, Berlin.
- Durst, F., Wang, A.B. (1989). Experimental and numerical investigation of the axisymmetric turbulent pipe flow over a wall-mounted thin obstacle. Proc. 7th Int. Symp. on Turbulent Shear Flows, Stanford University.
Indexed data:
| case058 (dbcase, confined_flow) | |
|---|---|
| case | 058 |
| title | Pipe constriction |
| author | Durst, Wang |
| year | 1991 |
| type | EXP |
| flow_tag | axisymmetric, separated, varying_cross_section |
