Turbulent Stokes Boundary Layer
LES by Salon, Armenio and Crise
Description
Large-eddy simulations (LES) are employed to investigate the Stokes boundary layer in the turbulent regime. The flow is driven by an harmonic pressure gradient in the x-direction: \[ \frac{dP}{dx}(t) = -U_o \omega \cos(\omega t) \] where \(P\) is the kinematic pressure, \(U_o\) is the maximum amplitude of the outer velocity and \(\omega\) is the angular frequency of the oscillations. The Reynolds number is defined as \[ Re_{\delta} = \frac{U_o \delta_s}{\nu} \] where \(\delta_s = \sqrt{2\nu/\omega}\) is the Stokes-layer thickness and \(\nu\) is the kinematic viscosity.
The Reynolds number investigated is \(Re_{\delta} = 1790\), that corresponds to test number 8 of the experimental study carried out by Jensen et al. (1989); at this \(Re_{\delta}\) turbulence is present in most of the oscillation cycle.
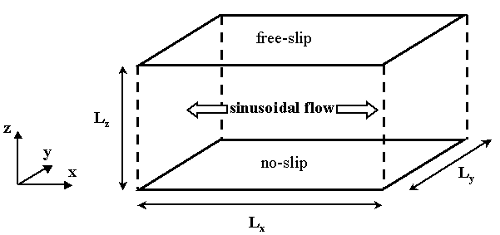
Boundary conditions are no-slip at the bottom wall and free-slip at the top boundary, as shown in figure 1. Due to the homogeneity in the spanwise and streamwise directions, periodic boundary conditions are taken there. The initial condition is set by starting the oscillatory motion from the fluctuating three-dimensional components of a steady fully-developed turbulent flow field. The statistics were accumulated over 15 complete cycles, by averaging over the (x,y)-planes of homogeneity, and in phase over half-cycle (ensemble average), since the flow field repeats every half-cycle with the sign of the streamwise velocity reversed. Thus 30 half-cycles were used for each phase of the oscillation.
Simulation Details
Flow geometry and coordinate system are sketched in figure 1. Several grid resolutions were considered in the LES study. Here we present data from grid C4 that has the following computational parameters: \(L_x = 50 \delta_s\), \(L_y = 25 \delta_s\), \(L_z = 40 \delta_s\), with 96x96x256 grid cells respectively in the \(x\), \(y\), \(z\) directions and non-dimensional grid spacing equal to: \(\Delta x^+ = 41\), \(\Delta y^+ = 21\), \(\Delta z^+_{min} = 2\), \(\Delta z^+_{max} = 22\).
Available Results
The available data consists of phase-averaged profiles of the rms fluctuating velocities \(u'\), \(v'\), \(w'\) and the shear stress \(\overline{uw}\) at 12 phase angles of 15o, 30o, 45o, 60o, 75o, 90o, 105o, 120o, 135o, 150o, 165o and 180o.
Velocities are normalized by \(U_o\), and the wall normal distance by the Stokes thickness, \(\delta_s\).
Sample plots of selected quantities are available.
The data files can be downloaded as compressed archives, or individually from the tables below.
| Flow Quantity | File |
|---|---|
| Rms \(u'\) velocity | u_rms_mean.dat |
| Rms \(v'\) velocity | v_rms_mean.dat |
| Rms \(w'\) velocity | w_rms_mean.dat |
| Shear stress \(\overline{uw}\) | uw_mean.dat |
References
- Jensen, B.L., Sumer, B.M., Fredsoe, J. (1989). Turbulent oscillatory boundary layers at high Reynolds numbers. J. Fluid Mech., Vol. 206, p. 265.
- Salon, S., Armenio, V., Crise, A. (2007). A numerical investigation of the Stokes boundary layer in the turbulent regime. J. Fluid Mech., Vol. 570, pp. 253-296.
Indexed data:
| case085 (dbcase, semi_confined_flow) | |
|---|---|
| case | 085 |
| title | Turbulent Stokes boundary layer |
| author | Salon, Armenio, Crise |
| year | 2007 |
| type | LES |
| flow_tag | unsteady, 2dbl |
