Sudden Pipe Expansion
Experiments by Szczepura
Description
Flow of water in a sudden pipe expansion. One of the aims of the experiment was to provide results which shed light upon the limitations of the standard \(k\)-\(\varepsilon\) model for turbulent flows.
2D axisymmetric flow with constant temperature.
Geometry
 Fig. 1: Pipe expansion geometry
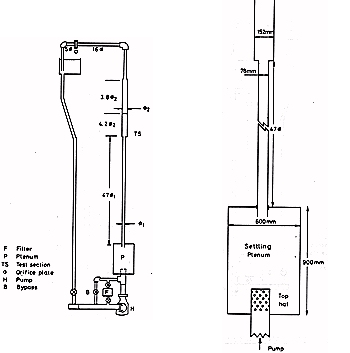
The experiments were performed in a specially designed facility. The axisymmetric pipe expansion (figure 1) forms part of a water-filled loop which is described below. The water circuit is illustrated in figure 2.
 Fig. 2: Water circuit and details of the plenum
To avoid corrosion products the rig was constructed of stainless steel and ABS plastic throughout. Demineralised water was used with an anti-fungicide additive to prevent algae growth. An HMD glandless pump, fitted with a Fluidrive fluid coupling, was used to provide a controllable mass flow. Fine control was achieved by using a bypass loop. The pump is of a rotating impeller design, so the outflow is very asymmetric. This asymmetry was removed by the plenum illustrated in figure 2.
The design of the 'top hat' was critical and the final version consisted of thirty-seven 25mm diameter holes providing radial jets which mix before reaching the side wall of the plenum. The flow then enters a straight pipe of internal diameter \(d = 78.3\) mm and length of \(47d\). The circularity of this pipe was to within +/- 0.4%. The actual measurement region is in a sudden expansion to a pipe of internal diameter \(D = 152.4\) mm. This was constructed of a stainless steel, sharp edged backstep and a glass cylinder of length \(4.2D\) and circularity +/- 0.2%. Spigotted and O-ring sealed joints were used throughout to ensure the squareness of the measurement region, backstep and inlet pipe. The glass cylinder, which was surrounded by a water-filled square section box to minimise refraction of the laser beams, was matched into a stainless steel tube giving an overall straight length downstream from the backstep of \(8.0D\). The mass flow rate in the rig was measured by an orifice plate installed according to BS1042 requirements giving an absolute accuracy of 1.5%. The circuit includes a free surface tank in which any entrained air can escape.
Flow Characteristics
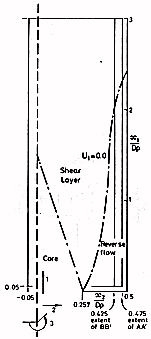
The flow can be divided into three distinct regions, a core, a shear layer and a reverse flow, as illustrated in figure 3.
These regions reflect the features of the flow observable in contour plots. An annular shear layer grows from the step edge, merging on the centreline at \(x/D = 1.5\) and reaching the wall at \(x/D = 2.3\). The shear stress has an elongated peak extending from \(x/D = 1.4\) to \(2.2\).
In the core region, which is monotonically reduced in size by the shear layer growth, upstream pipe conditions persist. The ratio of centreline velocity to bulk velocity was 1.18, the expected value for a pipe Reynolds number of \(4 \times 10^5\). The shear stress \(\overline{u_1u_2}\) had a pronounced curvature which indicates a non-developed flow.
The reverse flow region is of particular interest since previous experiments have failed to detect secondary recirculation. The evidence is that this secondary recirculation extends to \(x/D = 0.35\), and covers a significant portion of the backstep. If this reverse flow is viewed as a wall jet flowing into a corner then a recirculation is not very surprising. A minimum in the Nusselt number at about one step height downstream is interpreted as a counter-rotating secondary vortex.
Flow Parameters
- The fluid used in this experiment was water.
- Outlet pipe Reynolds number based on bulk velocity: \(Re = 2\times 10^5\).
Inflow Conditions
At \(x/D = -0.25\), in the inlet pipe, the flow is fully developed and the following measurements are provided along a radius for \(r/D\) ranging from 0 to 0.257 (in file tape-part4.dat:
Profiles of:
- First order moments: \(U\), \(V\)
- Turbulent kinetic energy: \(k\)
- Turbulent viscosity \(\nu_t\)
Experimental Details
Velocity measurements using a two-channel LDV system.
The turbulent kinetic energy dissipation rate \(\varepsilon\) has been estimated from spectral measurements, and the turbulent viscosity \(\nu_t\) has been derived from both values of \(\varepsilon\) and \(k\).
The friction velocity is defined as: \(U^* = (\tau_w/\rho)^{1/2}\) where \(\tau_w\) is the wall shear stress. The wall shear stress has been derived from experimental velocity measurements at \(r/D = 0.4771\) by fitting to an empirical logarithmic law.
The LDA System
The LDA system consists of modular units manufactured by Thermo Systems incorporated (TSI). These were assembled as in figure 4 to give three separate beams which co-incidentally cross in the measurement region.
The system is operated with the top beam (the reference beam) plane polarized at an angle \(0^o\), and the other beams at \(+45^o\) and \(-45^o\). This gives two sets of fringes in the control volume which are orthogonal and at \(45^o\) to the major axis of the measurement region. The 40MHz Bragg cell frequency shifts the reference beam, so both sets of fringes are moving. This ensures that results can be correctly interpreted in regions of reversing flow. The circuit was initially cleaned using the bypass filter fitted with 2 \(\mu\)m elements. After cleaning, no Doppler signal could be obtained. Then 2.95 \(\mu\)m latex spheres were introduced as scattering particles. This size was chosen to optimise the signal to noise of the system, the fringe spacing being 4.5 \(\mu\)m. The photomultiplier outputs were downmixed to frequencies comparable with the Doppler frequency (in the lMHz range), band-pass filtered to remove the pedestal and then processed by two trackers. The tracker outputs, which consists of a voltage proportional to the incoming frequency, were digitised using an in-house manufactured multiplexing analogue-to-digital convertor. The multiplexing rate was 15 kHz compared with a typical Kolmogorov frequency in the experiment of l0 kHz (see Szczepura 1985), so the signals can be treated as having been taken simultaneously. These digitised pairs were read by a PDP-8 computer. The time interval between reading of pairs was roughly 1 ms and was governed by the computer and not by particle arrivals in the control volume. This procedure ensures that there is no bias in the data collection towards higher velocities.
Measurement Errors
| \(\delta(U)\) | \(\pm 0.56\%\) |
| \(\delta(V)\) | \(\pm 3.3\%\) |
| \(\delta(u')\) | \(\pm 2.2\%\) |
| \(\delta(v')\) | \(\pm 3.4\%\) |
| \(\delta(w')\) | \(\pm 3.0\%\) |
| \(\delta(\overline{uv})\) | \(\pm 3.2\%\) |
Available Measurements
The data can be downloaded as compressed archives from the links below, or as individual files.
Sample plots of selected quantities are available.
At \(x/D = 0.05\), profiles for \(r/D\) ranging from 0 to 0.5 are provided (in file tape-part1.dat) of:
- First order moments: \(U\), \(V\)
- Second order moments: \(\overline{u^2}\), \(\overline{v^2}\), \(\overline{w^2}\), \(\overline{uv}\)
- Turbulent kinetic energy: \(k\)
- Profile of turbulent viscosity: \(\nu_t\)
At several \(x/D\) positions ranging from 0.05 to 2.95 with an increment of 0.1, the following profiles are provided for \(r/D\) ranging from 0 to 0.5 (in file tape-part2.dat):
- Profile of turbulent viscosity: \(\nu_t\)
- Profile of turbulent length scale
The friction velocity along the wall (\(u^*\)) for \(x/D\) ranging from 0.05 to 2.95 is provided in file tape-part3.dat.
At \(x/D = -0.25\), in the inlet pipe, profiles are provided for \(r/D\) ranging from 0 to 0.257 of (in file tape-part4.dat:
- First order moments: \(U\), \(V\)
- Turbulent kinetic energy: \(k\)
- Turbulent viscosity \(\nu_t\)
Reference
- Szczepura, R.T. (1985). Flow characteristics of an axisymmetric sudden pipe expansion - results obtained from the turbulence studies rig. Part 1 mean and turbulence velocity results. CEGB Berkeley TPRD/B/0702/N85.
Indexed data:
| case013 (dbcase, confined_flow) | |
|---|---|
| case | 013 |
| title | Sudden Pipe Expansion |
| author | Szczepura |
| year | 1985 |
| type | EXP |
| flow_tag | 3d, axisymmetric, separated, varying_cross_section |

