Wing-Body Junction Flow
Experiments by Ölçmen and Simpson
Description
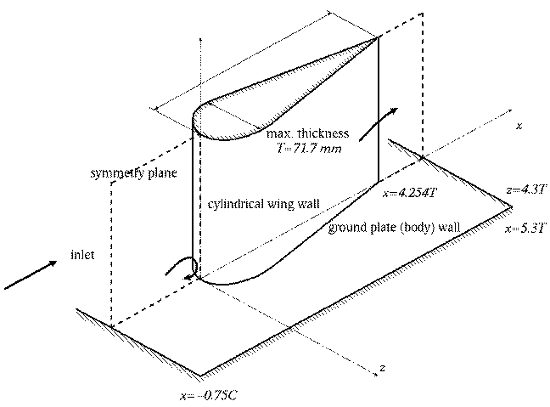
A three dimensional, pressure driven turbulent boundary layer created by a wing-body junction flow was experimentally studied. The geometry is shown in figure 1.
The wing used was a 3:2, semi-elliptical nosed NACA 0020 tailed symmetric profile which has a chord length of 30.5 cm (12 in.), maximum thickness of 7.17 cm (2.824 in.), and height of 22.9 cm (9.016 in.). The wing was mounted on the centreline of the flat plate wind tunnel floor. The nominal reference velocity of the flow was 27.5 m/s and the Reynolds number based on the momentum thickness at 0.75 chord upstream of the wing on the centreline of the tunnel and wing was \(Re_{\theta} = 5936\).
The data available includes the mean velocity and all Reynolds stresses at several (\(x\), \(z\)) stations on a line determined by translating in the direction of the mean velocity vector component parallel to the wall in the layer where the \(\overline{u^2}\) normal stress is maximum. Time-mean static pressure at a number of locations on the base wall and wing surface was also measured.
Measurement Details
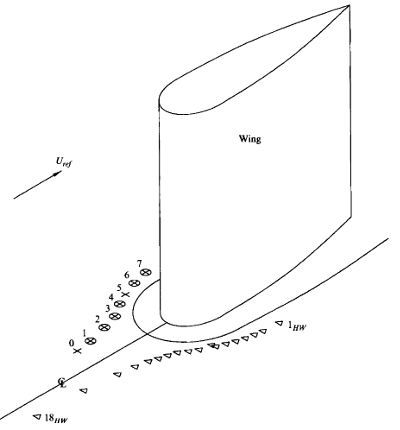
Data were obtained both with hot-wire (HW, at 24 stations) and laser Doppler-velocimeter (LDV, at 8 stations) techniques. The locations of these traverses are shown in figure 2. The incoming boundary layer was also measured at 15 different stations located at a distance of 0.75 chord upstream of the wing across half of the tunnel test section.
 Fig. 2: Hot wire and LDV measurement points (circles and triangles: hot wire points; crosses: LDV points)
Measurement Errors
The LDV measurements were taken twice due to the differences observed between the HW and the LDV data. The uncertainties in the mean velocity and the stresses were examined extensively.
Available measurements
Data available include:
- Pressure coefficient measurements on the flat base wall and wing surface
- Mean velocity and Reynolds stress profiles measured by hot-wire and LDV at a number of \((x,z)\) locations
Sample plots of selected quantities are available.
The data can be downloaded as compressed archives from the links below, or as individual files.
The file readme.txt has information on the data file naming and contents.
Pressure coefficients:
| cp-far.dat | \(C_p\) in the farfield, along lines \(z/T=\pm 3.17\) |
| cp-wall.dat | \(C_p\) on the test wall surrounding the wing |
| cp-nose.dat | \(C_p\) around the nose |
| cp-on.dat | \(C_p\) on the wing surface |
LDV and hot-wire profiles:
Other than for the upstream locations, three files are given for each profile, corresponding
to the velocities being expressed in three different coordinate systems. “tc” denotes Tunnel
Coordinates, where the \(x\)-axis is along the symmetry line of the wing. “fs” denotes
Free-Stream Coordinates, where the positive \(x\)-axis is in the direction of the mean
velocity at the boundary layer edge. “ns” denotes Normal Stress Coordinates, where the
positive \(x\)-axis is in the direction of the local mean velocity vector parallel to the
tunnel floor at the \(y\) location where the normal stress \(\overline{u^2}\) is maximum.
| Upstream hot-wire velocity and Reynolds stress profiles (at \(x/C=-0.75\)) | ||
|---|---|---|
| Location | Station ID | File |
| \(z/T=0\) | hw-up01 | hw-up01-tc.dat |
| \(z/T=0.25\) | hw-up02 | hw-up02-tc.dat |
| \(z/T=0.5\) | hw-up03 | hw-up03-tc.dat |
| \(z/T=0.75\) | hw-up04 | hw-up04-tc.dat |
| \(z/T=1\) | hw-up05 | hw-up05-tc.dat |
| \(z/T=1.25\) | hw-up06 | hw-up06-tc.dat |
| \(z/T=1.5\) | hw-up07 | hw-up07-tc.dat |
| \(z/T=1.75\) | hw-up08 | hw-up08-tc.dat |
| \(z/T=2\) | hw-up09 | hw-up09-tc.dat |
| \(z/T=2.25\) | hw-up10 | hw-up10-tc.dat |
| \(z/T=2.5\) | hw-up11 | hw-up11-tc.dat |
| \(z/T=2.75\) | hw-up12 | hw-up12-tc.dat |
| \(z/T=3.25\) | hw-up14 | hw-up14-tc.dat |
| \(z/T=3.75\) | hw-up16 | hw-up16-tc.dat |
| \(z/T=4.25\) | hw-up18 | hw-up17-tc.dat |
| Left Hand Side of Wing (Hot-wire data) | ||
|---|---|---|
| Location | Station ID | Files |
| \(x/C=0.305\); \(z/T=1.302\) | hw-lhs01 | hw-lhs01-tc.dat hw-lhs01-fs.dat hw-lhs01-ns.dat |
| \(x/C=0.222\); \(z/T=1.275\) | hw-lhs02 | hw-lhs02-tc.dat hw-lhs02-fs.dat hw-lhs02-ns.dat |
| \(x/C=0.180\); \(z/T=1.249\) | hw-lhs03 | hw-lhs03-tc.dat hw-lhs03-fs.dat hw-lhs03-ns.dat |
| \(x/C=0.140\); \(z/T=1.122\) | hw-lhs04 | hw-lhs04-tc.dat hw-lhs04-fs.dat hw-lhs04-ns.dat |
| \(x/C=0.099\); \(z/T=1.167\) | hw-lhs05 | hw-lhs05-tc.dat hw-lhs05-fs.dat hw-lhs05-ns.dat |
| \(x/C=0.061\); \(z/T=1.104\) | hw-lhs06 | hw-lhs06-tc.dat hw-lhs06-fs.dat hw-lhs06-ns.dat |
| \(x/C=0.022\); \(z/T=1.041\) | hw-lhs07 | hw-lhs07-tc.dat hw-lhs07-fs.dat hw-lhs07-ns.dat |
| \(x/C=0.016\); \(z/T=0.965\) | hw-lhs08 | hw-lhs08-tc.dat hw-lhs08-fs.dat hw-lhs08-ns.dat |
| \(x/C=-0.039\); \(z/T=0.913\) | hw-lhs09 | hw-lhs09-tc.dat hw-lhs09-fs.dat hw-lhs09-ns.dat |
| \(x/C=-0.075\); \(z/T=0.824\) | hw-lhs10 | hw-lhs10-tc.dat hw-lhs10-fs.dat hw-lhs11-ns.dat |
| \(x/C=-0.111\); \(z/T=0.721\) | hw-lhs11 | hw-lhs11-tc.dat hw-lhs11-fs.dat hw-lhs11-ns.dat |
| \(x/C=-0.150\); \(z/T=0.666\) | hw-lhs12 | hw-lhs12-tc.dat hw-lhs12-fs.dat hw-lhs12-ns.dat |
| \(x/C=-0.191\); \(z/T=0.620\) | hw-lhs13 | hw-lhs13-tc.dat hw-lhs13-fs.dat hw-lhs13-ns.dat |
| \(x/C=-0.230\); \(z/T=0.562\) | hw-lhs14 | hw-lhs14-tc.dat hw-lhs14-fs.dat hw-lhs14-ns.dat |
| \(x/C=-0.291\); \(z/T=0.513\) | hw-lhs15 | hw-lhs15-tc.dat hw-lhs15-fs.dat hw-lhs15-ns.dat |
| \(x/C=-0.374\); \(z/T=0.466\) | hw-lhs16 | hw-lhs16-tc.dat hw-lhs16-fs.dat hw-lhs16-ns.dat |
| \(x/C=-0.540\); \(z/T=0.398\) | hw-lhs17 | hw-lhs17-tc.dat hw-lhs17-fs.dat hw-lhs17-ns.dat |
| \(x/C=-0.790\); \(z/T=0.382\) | hw-lhs18 | hw-lhs18-tc.dat hw-lhs18-fs.dat hw-lhs18-ns.dat |
References
- Ölçmen, M.S., Simpson, R.L. (1992). Perspective: On the near wall similarity of three-dimensional turbulent boundary layers. Journal of Fluids Engineering, Vol. 114, pp. 487-495.
- Ölçmen, S.M., Simpson, R.L. (1995). An experimental study of a three-dimensional pressure-driven turbulent boundary layer. J. Fluid Mech., Vol. 290, pp. 225-262.
Indexed data:
| case063 (dbcase, flow_around_body, semi_confined_flow) | |
|---|---|
| case | 063 |
| title | Wing-body junction flow |
| author | Olcmen, Simpson |
| year | 1990 |
| type | EXP |
| flow_tag | 3d, surface_mounted_body |
