The CoLaPipe-The New Cottbus Large Pipe Test Facility at Brandenburg University of Technology Cottbus-Senftenberg
Experiments by König, Zanoun, Öngüner and Egbers
Description
The CoLaPipe is a novel test facility at the Department of Aerodynamics and Fluid Mechanics, Brandenburg University of Technology Cottbus-Senftenberg (BTU Cottbus-Senftenberg), set up to investigate fully developed pipe flow at high Reynolds numbers (\(Re_m \le 1.5 \times 10^6\), where \(Re_m\) is the bulk-based Reynolds number). The design of the CoLaPipe is closed-return with two available test sections providing length-to-diameter ratios of \(L/D = 148\) and \(L/D = 79\). A special feature is the numerically optimized contraction design.
The applications of different measuring techniques such as hot-wire anemometry and static pressure measurements to quantitatively evaluate the mean flow characteristics and turbulence statistics are discussed below. In addition, capabilities and limitations of available and new pipe flow facilities are presented and reconsidered based on their length-to-diameter ratio, the achieved Reynolds numbers, and the resulting spatial resolution. Here, the focus is on the facility design, the presentation of some basic characteristics, and its contribution to a reviewed list of specific questions still arising, e.g., scaling and structural behaviour of turbulent pipe flow, as well as the influence of the development length on turbulence investigations.
Experimental test facility
The CoLaPipe as a high Reynolds number test facility is built for the sake of fundamental research, e.g., a contribution to understanding the physical processes and dynamics of turbulence, as well as for supporting industrial projects, e.g., investigations on flow meter calibration for AVL List GmbH and Texas Instruments Incorporated. The range of capabilities of various pipe facilities are given in figure 1 in terms of the wall turbulence length scale, \(l_c = \nu /u_{\tau}\), as a function of the Kármán number (\(R^+ = u_{\tau}R/\nu\)), where \(u_{\tau}\) is the wall friction velocity, \(R\) is the pipe radius, and \(\nu\) is the kinematic viscosity. The figure points out the spatial resolution limitations (\(0.3 \le l_c \le 25\)) of the Princeton Superpipe, in spite of the large achievable Reynolds number range, see also Talamelli et al. (2009). The other two presented facilities provide a spatial resolution within the range of \(10 \le l_c \le 100\). Especially, the CoLaPipe allows measurements with high spatial resolution (\(100 \le l_c \le 300\)), utilizing the return line for a Kármán number range of \(500 \le R^+ \le 2000\). The return line has an inner diameter of 340 mm that permits also enough separation between the inner and outer scales to study the desired characteristics of turbulence. Here, an experimental setup is introduced for investigating turbulence in pipe flow as well as the transition process for high Reynolds numbers (\(Re_m \le 1.5 \times 10^6\)) with an improved spatial resolution in comparison to Princeton Superpipe, and we regard this as an intermediate step until the completion of CICLoPE.
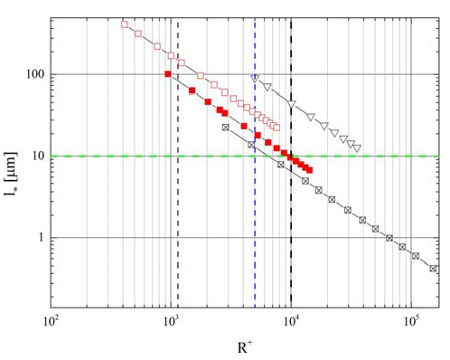 Fig. 1: Overview of recent pipe test facilities relating the viscous length l* to the Kármán number R+. ⮽ Princeton Superpipe; ■ (red) CoLaPipe; □ (red) CoLaPipe return line; ▽ CICLoPe; --- (green) minimum for sufficient spatial resolution; --- (brown) highest Reynolds number for DNS, R+=1142, for more detail see Wu & Moin (2008); --- (blue) future Reynolds number for DNS; and --- start of very high Reynolds number turbulence.
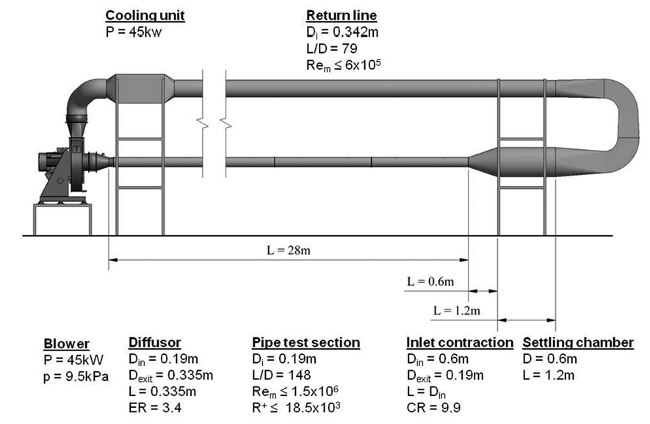 Fig. 2: Sketch of the CoLaPipe showing all presented parts, such as blower, pipe test section and return line, inlet contraction, settling chamber, and cooling unit. The control panel, to adjust the velocity, and the traversing mechanism with probe support are not shown.
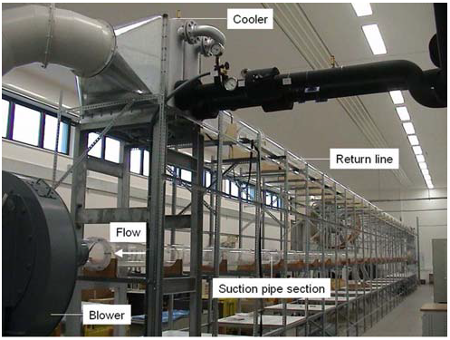 Fig. 3: Cutout of the CoLaPipe showing both test sections as well as some accessories. The lower one represents the actual test section with the inner diameter Di = 0.19 m, and the upper one represents the return line (Di = 0.342 m). Both test sections are made of acrylic glass.
All the relevant components described explicitly in König et al. (2014) are depicted in figure 2, i.e., test section, settling chamber, inlet contraction, tripping devices, power assembly, and heat exchanger, while figure 3 depicts the actual state test section as well as the return line. The inner pipe diameter of the suction side test section is \(D_i = 190 \pm 0.23\) mm, corresponding to a deviation of less than 0.12%. The total length of the suction side, \(L = 28\) m, provides a test section length-to-diameter ratio of \(L/D_i \approx 148\). The return line has an inner diameter of \(D_i = 342 \pm 0.32\) mm and a total length of \(L = 27\) m as well, providing a length-to-diameter ratio of \(L/D_i \approx 79\). These pipe lengths seem to be sufficient as development lengths for a settled mean flow as well as for fully developed turbulence and its higher order statistics. Both test sections' interior surfaces have a measured surface roughness of approximately 3 \(\mu\)m, being in terms of wall units 0.6 for the maximum Reynolds number of \(1.5 \times 10^6\). Thus, both pipe test sections can be treated as hydraulically smooth at all Reynolds numbers.
The suction and delivery pipes consist of 13 segments, each pipe segment is 2 m long, connected together by custom-designed flanges. Every segment is centered in connection with the adjacent one based on their inner diameter by the application of laser alignment. A careful design of tbe flanges, together with the laser alignment, limits misalignment of the segments to less than 0.02 mm/m. The level of the centreline of the suction pipe test section is 1.55 m from the ground, in order to allow an easy access to the test section while the operator is standing on the floor of the laboratory. The level of the return line is 4.55 m from the ground, which requires a working platform.
Measuring techniques and data acquisition system: pressure and temperature measurements
For the understanding of the physical phenomena and the occurring processes in turbulent pipe flow, it is essential to obtain measurement data with high spatial and temporal accuracy. Due to this fact, the application of suitable measuring techniques is very important. In the following, we describe the applied pressure and temperature measurements as well as velocity measurements.
Measuring pressure or pressure distribution is essential for pipe flow investigations to quantitatively characterize the flow field. One of the key features of the CoLaPipe facility is the direct estimation of the wall friction velocity \(u_{\tau}\) needed for the purpose of data normalization. The wall friction velocity is defined as \(u_{\tau} = (\tau_w/\rho)^{1/2}\), where \(\rho\) is the density of the working fluid and \(\tau_w\) is the wa1l shear stress, \(\tau_w= -(dP/dx)D/4\). The wall friction velocity is obtained by carrying out accurate mean pressure gradient measurements. To provide the pressure gradient, \(dP/dx\), pressure tappings are located along the pipe test section, 1 m apart. At each pressure measuring location three pressure tappings are installed around the circumference to verify the pressure readings. Due to the fact that manufacturing inaccuracies such as drilling problems can influence static pressure measurements the installation of the pressure tappings (\(D = 500 \mu\)m, \(L/D = 10\)) is handled with great care, i.e., smoothness was ensured around the pressure tappings. All pressure measurement points are connected to two pressure scanners (PSI 9116 Ethernet Pressure Scanner) provided with 16 channels for simultaneous pressure readings. The corresponding static pressure is then recorded for different boundary conditions, i.e., different inlet flow velocities. These intensive pressure measurements are utilized to ensure the state of flow development.
The working temperature is measured by a thermocouple type T and the ambient temperature is recorded by a standard thermometer system. In addition to the pressure and temperature measurements, the air density and kinematic viscosity are calculated corresponding to the flow temperature in the pipe also for data normalization.
The distribution of the mean velocity, the fluctuating velocity, and the corresponding statistical quantities are measured using a constant-temperature hot-wire anemometer (CTA). Single-wire probes are applied with different diameters of 2.5 \(\mu\)m, 3.8 \(\mu\)m, 5.0 \(\mu\)m, and 6.3 \(\mu\)m, and lengths of 1250 \(\mu\)m and 1270 \(\mu\)m, as well as X-wire probes with a diameter of 5.0 \(\mu\)m, and a length of 1270 \(\mu\)m for more detailed investigations on structures and velocity correlations. Especially for this purpose it is important to take care of the non-dimensional wire length (\(l_*=l u_{\tau}/\nu\)) with respect to spatial averaging effects. In this study a maximum \(l_*\) of 245 was obtained for the maximum value of \(u_{\tau}\) and the longest \(l_{wire}\). This is too high to resolve structures accurately in the case of high Reynolds number turbulence. This problem can be limited, e.g., by using self-made single-wire probes or another technique. Because of this fact, attention is here focused on high Reynolds numbers, \(Re_c \le 9 \times 10^5\), where the influence on \(l_*\) is decreased. Hence, for the present setup the non-dimensional wire length is approximately 120, which enables the structural behaviour to be investigated without spatial averaging effects.
Before conducting each set of measurements it is essential to calibrate the probes against a reference velocity, to determine the relationship between the anemometer output voltage and the corresponding physical property - in this case the fluid flow velocity. To achieve an accurate calibration an ex-situ calibration procedure is used, depicted in figure 4, providing a well-known velocity profile. Using the control unit of the CTA, it is possible to adjust the reference velocities in the desired range within an accuracy of 0.15%, and to determine the calibration curve and the related calibration coefficients. A fourth-order polynomial fit is the basis for the estimation. In addition, the air temperature inside the calibration unit is always measured within an accuracy range of +/- 1°C to correct any temperature drift instantaneously allowing a point by point correction. The ambient conditions are monitored during each test run using an electronic barometer and thermometer. All the measuring equipment is connected to an A/D converter board with a 16-bit resolution. In addition, a computer-based programming system is used for acquiring and processing all measurement data.
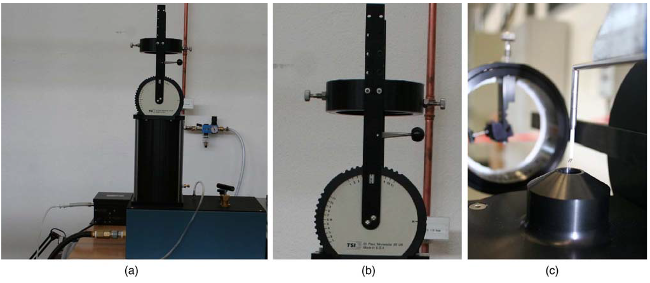 Fig. 4: Details of the ex-situ calibration unit. (a) Ex-situ calibration unit with air supply; (b) variable angle adjustment; (c) calibration unit contraction with probe to be calibrated.
 Fig. 5: Different tripping devices. (a) Orifices with different blockage ratios and (b) arrangement of organized tape letters.
Tripping laminar flows, generally known as artificial transition, is a well-known method to induce turbulence of an early flow state. A variety of tripping methods are available, such as using cylindrical wires, sand papers, partial inlet blockage, i.e., orifices, and organized tape letters. Here, orifices shown in figure 5 are used, blocking the entrance cross-section of the pipe by a certain percentage. The orifice is mounted at the inlet of the test section, i.e., at \(x = 0\), to trigger the flow over the circumference of the pipe. The blockage area in percentage can be varied between 5% to 40% by changing the orifice height according to previous investigations. Thus it can be ensured that all turbulent flow properties are sufficiently developed at the measuring station. Another technique which can be used for triggering the flow is gluing of sand paper strips on the inner surface of the pipe entrance, as well as utilizing organized tape letters, see figure 5(b). With these various devices it is possible to research tripping device effects on mean and fluctuating flow properties over a wide range of Reynolds numbers. In addition, similarities and differences between natural, i.e., transition without certain disturbances, and artificial transition in pipe flow can be investigated.
Experimental data: Flow characteristics
The design requirements of the CoLaPipe claim for high-quality results in all fields of interest, especially in turbulence. This implies fully developed turbulent flow and for this reason a developed velocity profile. To approach these aims, well defined inlet flow conditions, i.e., a uniform velocity profile with low turbulence intensity level at the exit of contraction, have to be provided. As shown in figure 6, there is a slightly increasing turbulence intensity (\(u'/\overline{U}\)) with respect to the bulk-based Reynolds number \(Re_m\), but always less than 0.5% (see König et al, 2014). It is not only the inlet turbulence intensity that is important for the development of the flow, but also the velocity profiles at the entry of the pipe test section. Here, the main requirement is a uniform velocity distribution for all Reynolds numbers. The measured mean profiles for a selected Reynolds number range ( \(Re_m = (0.97-6.8) \times 10^5\) ) are also shown in figure 6. Both figures denote the very good inlet flow conditions of the CoLaPipe, which are the basis for recent pipe flow investigations within a high Reynolds number range. To illustrate the possibilities figure 7 depicts one mean velocity profile representing the lower bound of the feasible Reynolds number range. For these data t was possible to resolve the viscous sublayer with a sufficient number of data points in quite a good manner. This is visualized through the supplementary cutout within figure 7. The minimum wall distance that could be achieved with the measurement technique, which is here the single hot-wire anemometry, can also be seen as (\(y^+ \approx 1.5\)). However, this distance is strongly affected by the Reynolds number due to the decrease in the viscous sublayer thickness as \(Re\) increases. Another important fact is that there exits enough separation between the boundary layers, e.g., the linear and the logarithmic as well as the outer part.
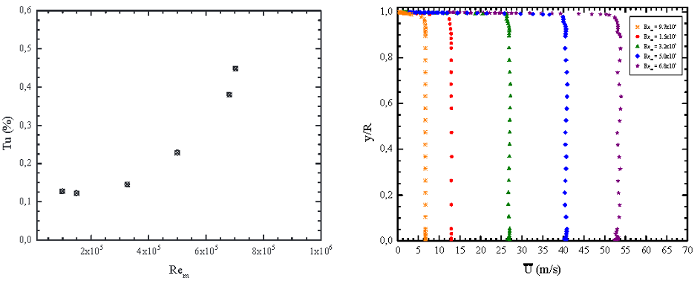 Fig. 6: Turbulence intensity level (\(u'/\overline{U}\)) versus bulk-based Reynolds number (\(Re_m\)), left, and uniform velocity profiles for selected bulk-based Reynolds numbers (\(Re_m\)), right, at the contraction exit without triggering the flow.
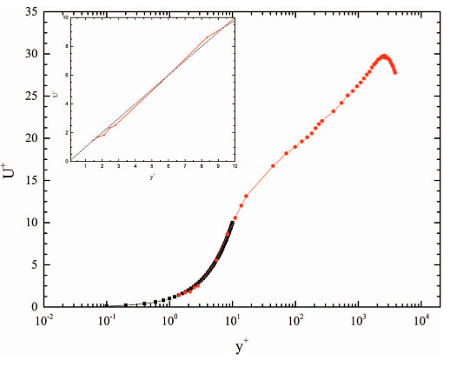 Fig. 7: Mean velocity profile as function of the normalized distance in wal units for Re = 1.6E5 - red dotted line. The supplement represents an enhancement of the linear part of the velocity profile. The black dotted line depicts the linear law of the wall up to a range of y+ = 10.
Available Data
The data available consists of the inflow velocity profiles mentioned above, together with the associated turbulence intensity levels.
Sample plots of selected quantities are available.
The data files can be downloaded as compressed archives, or as individual files.
| Mean Velocity Profiles | |
|---|---|
| \(Re_m\) | File |
| \(9.7\times 10^4\) | umean-re97e4.dat |
| \(1.5\times 10^5\) | umean-re15e5.dat |
| \(3.2\times 10^5\) | umean-re32e5.dat |
| \(5.0\times 10^5\) | umean-re50e5.dat |
| \(6.8\times 10^5\) | umean-re68e5.dat |
| Turbulence Intensities | |
| turb-intensity.dat | |
| Excel Sheets containing all the above data | |
| pipe-inlet-data.xlsx | |
References
- Talamelli, A., Persiani, F., Fransson, J.H.M., Alfredsson, P.H., Johansson, A.V., Nagib, H.M., Rüedi, J.D., Screenivasan, K.R., Monkewitz, P.A. (2009). CICLoPE<97>a response to the need for high Reynolds number experiments. Fluid Dyn. Res., Vol. 41, p. 021407.
- Wu, X., Moin, P. (2008). A direct numerical simulation study on the mean velocity characteristics in turbulent pipe flow. J. Fluid Mech., Vol. 608, pp. 81-112.
- König, F., Zanoun, E.-L., Öngüner, E., Egbers, C. (2014). The CoLaPipe-The new Cottbus large pipe test facility at Brandenburg University of Technology Cottbus-Senftenberg. Rev. Sci. Instrum., Vol. 85, p. 075115.
Acknowledgements
The authors gratefully acknowledge the financial support for their research work from the German Science Foundation (DFG), Germany, FOR 1182 - DFG Research Group: Transport and Coherent Structures in Turbulent Rayleigh-Bénard, Taylor-Couette and Pipe Flows.
Indexed data:
| case093 (dbcase, confined_flow) | |
|---|---|
| case | 093 |
| title | The CoLaPipe - The new Cottbus large pipe test facility at Brandenburg University of Technology |
| author | Konig, Zanoun, Onguner, Egbers |
| year | 2015 |
| type | EXP |
| flow_tag | axisymmetric, constant_cross_section |