Backward-Facing Step with Uniform Normal Bleed
Experiments by Yang, Tsai, Tsai
Description
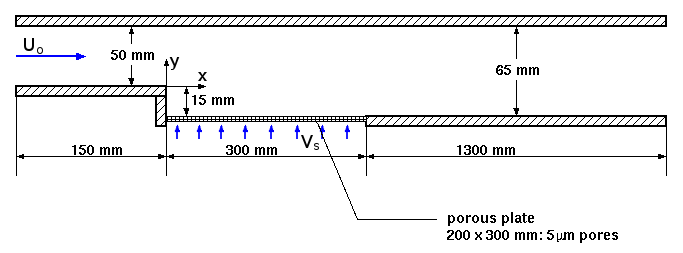
The case examines the effect of normal mass bleed into the separated-reattaching flow behind a back-ward-facing step, for a geometry shown in figure 1.
Three Reynolds numbers are considered, \(Re = U_oH/\nu = 1.91 \times 10^4\), \(3.82\times 10^4\) and \(5.74 \times 10^4\), with bleed rates of air flow through the base plate of 0, 180, 360 and 540 litres/min. Not all data are available for every flow configuration combination.
 Fig. 1: Flow geometry and configuration
The experiments were conducted in an open-circuit wind tunnel powered by a 75 kW Roots blower with a speed controller. The blower provided a maximum flow rate of 50 m3/min with a maximum static pressure of 70 kPa.
The dimensions of the test section were 5 x 20 cm2. The step height was chosen to be 1.5 cm, giving a channel expansion ratio of 1.3 and an aspect ratio (test section width to step height) of 13.3, ensuring two-dimensional flow conditions. The configuration and dimensions of the test section are shown in figure 1.
Experimental Details
The velocities were measured with a three-beam, 2-component backward-scattering LDA, which was connected to a computer-controlled traversing system for two-dimensional movement. The resolution of the traverse system was 0.03 mm. The instruments were mounted on an optical bench that was placed on a traverse table for major movement.
The static pressure near the base was measured with a tube, outer diameter 1.5mm and L-shaped, having eight 0.1 mm holes drilled around its end.
Experimental Conditions
The principal parameters of the experiments were the stream velocity ahead of the step (\(U_o = 20\), \(40\) and \(60\) m/s) and the normal bleed rate of air through the base plate (\(Q = 0\), \(180\), \(360\) and \(540\) litres/min). The corresponding Reynolds numbers based on the upstream velocity and the step height, \(U_oH/\nu\), were \(1.91\times 10^4\), \(3.82\times 10^4\) and \(5.74 \times 10^4\).
Injection velocities, \(V_s\), of the air bleed corresponding to the flow rates \(Q\) given above were 0, 0.05, 0.10, and 0.15 m/s. Turbulence intensity of the flow upstream of the step was 0.8 percent. The boundary layer just upstream of the step was turbulent, having a maximum turbulence intensity around 6 percent. The thickness of the boundary layer before the step was \(0.6 H\) at \(U_o = 20\) m/s.
Westphal and Johnson (1984) reported that a similarity scaling in flow structure could be attained if the spatial co-ordinate was normalised by the reattachment length, and so in presenting some of the data the length of the re-circulation zone, \(X_r\), is chosen as the reference of normalisation, defined as the distance from the step to the location at which the mean horizontal velocity at \(0.05 H\) above the wall was zero.
The LDA measurements were conducted across 14 cross sections at distances of 0, 0.2, 0.3, 0.4, 0.5, 0.6, 0.7, 0.8, 0.9, 1.0, 1.1, 1.3, 1.5 and 2.0 \(X_r\) downstream of the back step. Velocity data were collected at every \(0.05H\) in the range \(y/H= - 0.9\) to \(1.0\). The measurement period for each data point was controlled to be less than 1 minute.
Measurement Errors
The air injected from the base plate into the test section was supplied by a 1.5 kW compressor. The pressure differences across the plate for various test conditions were in the range 4.8~6.4 kPa, whereas the maximum pressure drop in the re-circulation zone was 0.1 kPa. Since the variation of the pressure difference across the porous plate within the test section was two-orders of magnitude higher than the variation of the static pressure in the flow, the normal bleed rates over the whole plate varied only 3 percent and were thus assumed to be uniform. The flow structures were investigated quantitatively via the measurement of velocities and pressures.
2048 measurements were normally made at each measuring point. The corresponding maximum uncertainties were 3.2 percent for mean axial velocity, 4.9 percent for mean normal velocity and 4.9 percent for turbulence intensity at the 95 percent confidence level. The corresponding maximum uncertainty for Reynolds shear stress was 13 percent.
Available measurements
The data available includes:
- Profiles of mean velocity, turbulent intensity (defined as \(((\overline{u^2}+\overline{v^2})/U_o)^{1/2}\)) and Reynolds shear stress at a selection of \(x\) locations for the \(U_o=20\) m/s cases
- Wall static pressure profiles for the \(U_o=20\) and \(60\) m/s cases.
- Reattachment lengths for all cases
Sample plots of selected quantities are available.
The data can be downloaded as compressed archives from the links below, or as individual files.
Profiles of mean velocity, turbulence intensity and shear stress for the \(U_o=20\) m/s cases:
Wall static pressure profiles:
Reattachment length (for all cases): xr.dat
Reverse flow rate (for \(U_o=20\) m/s cases): rev-mass.dat
References
- Westphal, R.V., Johnson, J. P. (1984). Effect of initial conditions on turbulent reattachment downstream of a backward-facing step. AIAA Journal, Vol. 22, pp. 1727–1732.
- Yang, J.T., Tsai, B.B., Tsai, G.L. (1994). Separated-reattaching flow over a backstep with uniform normal mass bleed. Journal of Fluids Engineering, Vol. 116, pp. 29-35.
Indexed data:
| case056 (dbcase, confined_flow) | |
|---|---|
| case | 056 |
| title | Backward-facing step with uniform normal bleed |
| author | Yang, Tsai, Tsai |
| year | 1994 |
| type | EXP |
| flow_tag | 2d, separated, varying_cross_section |