Local and Time-Resolved Wall Heat Flux in Turbulent Rayleigh-Bénard Convection
Experiments by du Puits and Hertlein
Description
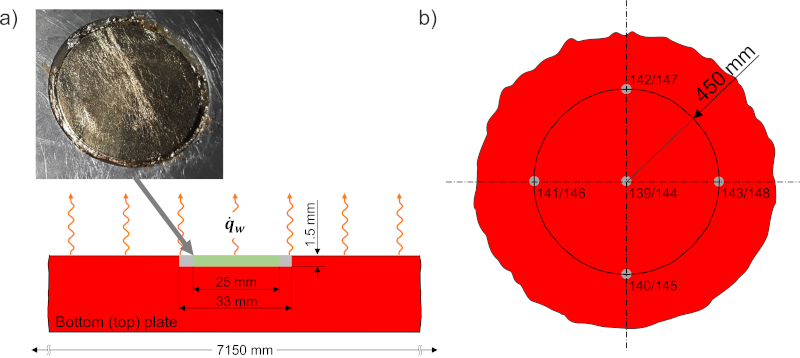
In this data set, we provide direct and time-resolved measurements of the local wall heat flux in turbulent Rayleigh-Bénard convection in air. The measurements have been performed at the heated bottom and the cooled top plate of a large-scale Rayleigh-Bénard experiment which is called “Barrel of Ilmenau” (see also cases 90, 91 and 95). We used heat flux plates to measure the wall heat flux locally and time-resolved. These sensors are little discs of 1.5 mm thickness and a sensitive area of 25 mm diameter. They have been flush mounted into the surfaces of both plates. We installed five sensors in each of both plates, one at the centre and four others equally spaced at a radius of \(R=0.45\) m (see figure 2). Here we provide only the data from the two central sensors. Data from the other sensors can be requested from the first author. Our measurements cover a parameter range in Rayleigh number from \(Ra=8.5\times 10^5\) to \(Ra \approx 2.6\times 10^9\), while the Prandtl number was fixed at \(Pr=0.7\). The definition of these numbers is as follows: \[ Ra = \frac{\beta g \Delta T H^3}{\nu \kappa}, \qquad Pr = \frac{\nu}{\kappa} \] with \(\Delta T\) and \(H\) being the temperature difference and the vertical distance between the heated bottom and the cooled top plate, \(\beta\), \(\nu\), and \(\kappa\) being the thermal expansion coefficient, the kinematic viscosity and the thermal diffusivity of the fluid, and \(g\) being the gravitational constant of the Earth. Each time series of the local wall heat flux at a single Rayleigh number covers a period of 24 hours with a data rate of 5 s-1. A more detailed description of the experimental facility, the measurement technique and a table with a selection of the parameters is provided in the subsequent section.
Experimental Set-up, Measurement Technique and Main Parameters
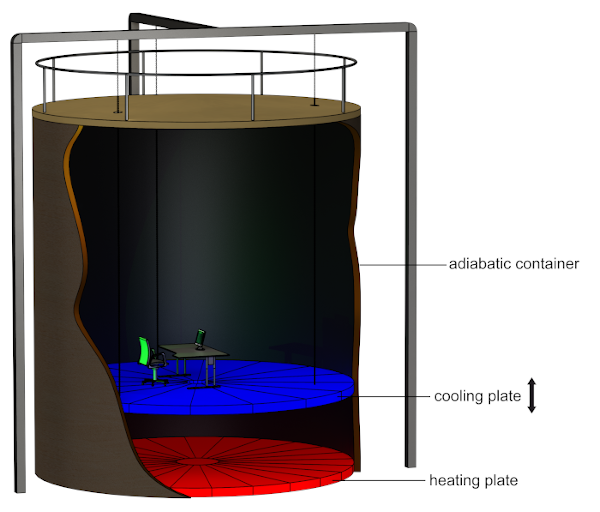
All measurements have been undertaken in the large-scale RB experiment “Barrel of Ilmenau” (figure 1). The experiment consists of an adiabatic container 8.0 m in height and 7.1 m in diameter which is filled with air (\(Pr=0.7\)). At the bottom of the container, a heating plate composed of an electrical underfloor heating and a water-flown plate of Aluminium on top heats the air. The cooling plate at the top of the container consists of 16 segments with water circulation inside as well. The segments are mounted on a solid steel construction and are separately leveled perpendicular to the vector of gravity. The entire construction with a weight of about 6 tons is mounted on a crane and can be lifted up and down. The sandwich technology of the heating and the cooling plates guarantees a uniformity of the temperature at their surfaces with a deviation of the local temperature less than 1% (1.5% for the cooling plate) of the total temperature drop \(\Delta T\) between the plates. Separate PID-controllers keep the temperature of both plates in a band of +/-0.02 K around the value adjusted. The sidewall of the container is shielded by an active compensation heating system. Eighteen electrical heating elements are arranged between an inner and an outer isolation of 16 and 12 cm thickness, respectively. Their temperatures are controlled to be equal to the temperatures at the inner surface of the wall, with the consequence of virtually no heat flux across the sidewall. More detailed information on the experimental facility can be found in du Puits et al (2007, 2013).
 Fig. 1: Sketch of the large-scale Rayleigh-Bénard experiment "Barrel of Ilmenau". The sketch shows the experiment in the actual configuration for the measurements with a distance of the plates of H=0.9 m.
We used heat flux plates to measure the local heat flux released and absorbed from the surfaces of the hot bottom and the cold top plates, respectively. The sensors, developed and provided by the company Phymeas GbR (http://www.phymeas.de) are little discs with a well known heat conductivity. A heat flux throughout such a disc generates a small temperature drop which amounts, in our experiment, to less than 1 K at the maximum temperature difference of \(\Delta T=50\) K between the plates. Several hundreds of thermocouples are arranged at both sides of the disc to detect the temperature difference and to provide a thermovoltage of typically about 1 mV per 100 Wm-2. The heat flux plates have a total diameter of 33 mm, however, only the inner 25 mm area is being active for the measurement. We installed five such sensors each in the bottom and the top plates of our experiment. One is located at the centre of each plate and the other four are equally spaced at a radius of \(R=0.45\) m. They are flush-mounted in a notch in the surface of the bottom (top) plate (see figure 2). This prevents measurement errors caused by artificial turbulence at the edges of the sensors. We were also aware of the radiative heat flux, since radiation may contribute significantly to the heat transport in turbulent RB convection at room temperature. We exclude this from the measurement as much as possible by coating the surfaces of the heat flux sensors with a thin Gold layer. The emissivity of such a gold coated surface is very small (\(\varepsilon \approx 0.03\)), but not completely negligible with respect to the total heat flux throughout the RB cell. We consider this fact and we corrected our measurement results accordingly.
 Fig. 2: Heat flux sensor with gold coating embedded in the heating plate of the large-scale Rayleigh-Bénard experiment "Barrel of Ilmenau" (a) and location of the heat flux sensors at the surfaces of the cooling/heating plate (b). The sensors numbered 139..143 are those in the cooling plate, the sensors numbered 144..148 are those in the heating plate.
The measurements in the upper range of \(Ra\) (\(5.0\times 10^7<Ra<2.6\times 10^9\)) have been undertaken in the full-size container with \(D=7.1\) m and \(H=0.9\) m, while for the lower \(Ra\) values (\(8.5\times 10^5<Ra<5.3\times 10^7\)) a smaller inset of \(D=2.5\) m and \(H=0.28 m\) has been installed between the two horizontal plates of the larger test section. The temperatures of the heating and the cooling plates have been set between \(30.0^o\text{C}<T_{hp}<47.5^o\text{C}\) and \(30.0^o\text{C}>T_{cp}>12.5^o\text{C}\), respectively, symmetrically around a (theoretical) bulk temperature \(T_b=30^o\text{C}\). We deviate from this scheme only with the settings for the highest \(Ra\) number (\(Ra=2.6\times 10^9\)), for which \(T_{hp}=70.0^o\text{C}\), \(T_{cp}=20.0^o\text{C}\), because of a technical limitation of our refrigeration system. Each measurement consists of a 24-hours time series with a sampling frequency of 5 Hz. Before starting a measurement, the experiment had to be in a steady state with the temperatures of the heating and the cooling plates, as well of the sidewall, being constant. This takes usually between 24 and 72 hours. The main parameters of the experiments are listed in the table below, giving the Rayleigh number \(Ra\), diameter \(D\) and height \(H\) of the RB cell, and the temperatures of the heating and the cooling plates, \(T_{hp}\) and \(T_{cp}\) for the various measurement runs.
| \(Ra\) | \(D\) [m] | \(H\) [m] | \(T_{hp}\) [oC] | \(T_{cp}\) [oC] |
| \(8.54\times 10^{5}\) | 2.5 | 0.27 | 30.25 | 29.75 |
| \(1.52\times 10^{6}\) | 2.5 | 0.28 | 30.40 | 29.60 |
| \(2.66\times 10^{6}\) | 2.5 | 0.28 | 30.70 | 29.30 |
| \(4.26\times 10^{6}\) | 2.5 | 0.28 | 31.11 | 28.87 |
| \(7.04\times 10^{6}\) | 2.5 | 0.28 | 31.85 | 28.15 |
| \(1.18\times 10^{7}\) | 2.5 | 0.28 | 33.05 | 26.95 |
| \(1.91\times 10^{7}\) | 2.5 | 0.28 | 35.00 | 25.00 |
| \(3.17\times 10^{7}\) | 2.5 | 0.28 | 38.25 | 21.75 |
| \(5.27\times 10^{7}\) | 2.5 | 0.28 | 43.60 | 16.40 |
| \(5.04\times 10^{7}\) | 7.1 | 0.90 | 30.40 | 29.60 |
| \(8.82\times 10^{7}\) | 7.1 | 0.90 | 30.70 | 29.30 |
| \(1.39\times 10^{8}\) | 7.1 | 0.90 | 31.10 | 28.90 |
| \(2.33\times 10^{8}\) | 7.1 | 0.90 | 31.85 | 28.15 |
| \(3.84\times 10^{8}\) | 7.1 | 0.90 | 33.06 | 26.95 |
| \(6.29\times 10^{8}\) | 7.1 | 0.90 | 35.00 | 25.00 |
| \(1.04\times 10^{9}\) | 7.1 | 0.90 | 38.25 | 21.75 |
| \(1.72\times 10^{9}\) | 7.1 | 0.90 | 43.60 | 16.40 |
| \(2.21\times 10^{9}\) | 7.1 | 0.90 | 47.48 | 12.53 |
| \(2.55\times 10^{9}\) | 7.1 | 0.90 | 70.00 | 20.00 |
Available Data
The data set incorporates time series of the dimensional wall heat flux \(\dot{q}_w\) [W/m2] and the dimensionless Nusselt number: \[ Nu = \frac{\dot{q}_w+\dot{q}_d}{\dot{q}_d} \] with \(\dot{q}_w\) and \(\dot{q}_d\) being the measured wall heat flux (corrected by the radiative fraction) and the heat flux by diffusion.
Sample plots of selected quantities are available.
The data files can be downloaded as compressed archives, or individually from the table below.
Data files contain time series of the local wall heat flux \(\dot{q}_w\) in W/m2 and the Nusselt number \(Nu\). The subscripts 139 and 144 denote the number of the sensor according to figure 2.
References
- du Puits, R., Resagk, C., Thess, A. (2007), Breakdown of wind in turbulent thermal convection. Phys. Rev. E, Vol. 75, p. 016302.
- du Puits, R., Resagk, C., Thess, A. (2013), Thermal boundary layers in turbulent Rayleigh-Bénard convection at aspect ratios between 1 and 9. New J. Phys., Vol. 15, p. 013040.
Acknowledgment
This work was granted by the German Research foundation under the Grant No. PU436/11-1). We also thank Sabine Scherge and Vigimantas Mitschunas for their valuable contribution to run the experiments and to do the measurements.
Indexed data:
| case094 (dbcase, confined_flow) | |
|---|---|
| case | 094 |
| title | Local and time-resolved wall heat flux in turbulent Rayleigh-Benard convection |
| author | du Puits, Hertlein |
| year | 2021 |
| type | EXP |
| flow_tag | 3d, scalar, buoyant |